Market Update | Fourth Quarter 2025
January 23, 2026
Key Highlights to Keep You Informed
Shutdown Ends, Economic Impact Lingers
The federal government shut down on October 1 after Congress failed to pass a funding bill for the new fiscal year. Operations did not fully resume until mid-November, making it the longest shutdown on record. While much of the economic disruption was temporary, the Congressional Budget Office estimates a permanent loss of roughly $11 billion in Gross Domestic Product i. Lawmakers ultimately agreed to fund the government through January 30, 2026, requiring Congress to act again early this year to avoid another disruption.
The Fed Cut Rates
The Federal Reserve Open Market Committee cut rates twice during the quarter by 0.25% each, bringing the federal funds rate, including the September cut, to a range of 3.50% to 3.75%. While most members view easing inflation and labor market risks as justification for cuts, both decisions faced higher dissent than recent actions. Some officials remain concerned inflation is still elevated and data remains limited, while recent appointee Stephen Miran pushed for a larger 0.50% cut to respond more forcefully to slowing labor conditions.
AI Bubble Concerns Return
Continued investment in Artificial Intelligence infrastructure and rising equity markets revived concerns about a potential “AI bubble,” a theme that dominated financial headlines throughout the fourth quarter. Prominent voices, including JPMorgan Chief Executive Officer Jamie Dimon, cautioned that markets have historically overvalued transformative technologies, pointing to the Internet boom of the 1990s. Similarities include elevated valuations and heavy investment without clear paths to profitability. Key differences from the 1990s, such as meaningful cash flow generation and greater awareness of valuation risk, may help keep excesses limited.
Tariffs Ease but Stay Elevated
Trade tensions persisted but continued to ease throughout the quarter. By December 31, the average tariff rate on goods imported for consumption was estimated to be 15.6%ii. This was well below the roughly 30% rate implied by the April 8 proposals yet still represented the highest tariff level since the late 1930s.
Venezuela Strike Raises Energy Questions
A surprise U.S. military strike on Venezuela in early January 2026 resulted in the capture of President Nicolás Maduro, a move that drew strong global attention and divided international opinion. U.S. officials and some allies have argued the action will have limited short-term economic impact but could carry meaningful implications for the energy sector. Despite Venezuela holding around 17% of the world’s known oil reserves, current production has fallen to less than one million barrels per year or about 1% of the world’s energy consumption iii. Should oil production reach prior levels of over three million barrels per year prior to the country’s nationalization of the industry, sanctions and under investment in infrastructure, additional supply could put downward pressure on oil prices and boost supply for U.S. gulf coast refiners.
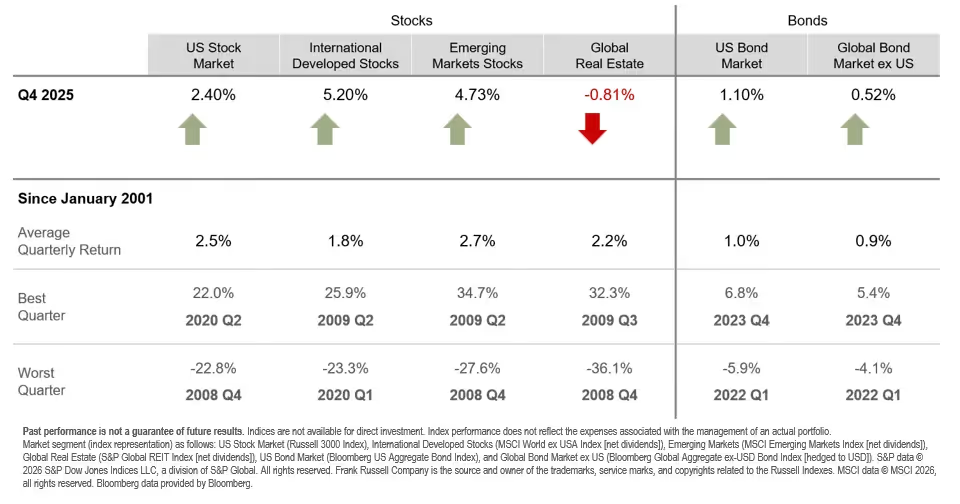
Quarterly Market Summary
Returns (USD), as of December 31, 2025
Notable Events in Q4:
October
The shutdown’s effects were felt across the economy, delaying key data releases and disrupting air travel as some air traffic controllers missed work. While furloughed federal employees were ultimately paid, the interruption added uncertainty early in the quarter. Despite these headwinds, equity markets advanced on strong corporate earnings, expectations for additional Federal Reserve rate cuts, and easing trade tensions. Although President Trump initially threatened to impose 100% tariffs on China in November, he reversed course mid-month, citing sustainability concerns and announcing narrower tariffs on selected goods instead.
November
The government shutdown extended through November 12, limiting economic data and adding uncertainty ahead of December’s Federal Reserve meeting. Market performance was muted, with returns largely flat for the month. Geopolitical tensions increased as the U.S. military deployed the USS Gerald R. Ford to the Caribbean, escalating its standoff with Venezuelan President Nicolás Maduro. Meanwhile, President Trump revised his reciprocal tariff proposals, removing key agricultural products such as coffee, beef, and cocoa just ahead of the Thanksgiving holiday.
December
Oil prices continued to decline, finishing the year down roughly 20%, while the Federal Open Market Committee delivered a widely expected 0.25% interest rate cut, accompanied by cautious forward guidance. The Committee’s preferred inflation measure, the Personal Consumption Expenditures Price Index, rose to 2.8% compared to 2.1% in the second quarter of 2025, with core inflation increasing to 2.9%.1 Globally, the European Central Bank held rates steady, while the Bank of Japan raised rates as part of its policy normalization efforts. Economic data released after the shutdown painted a mixed picture, with signs of moderating inflation and a softening labor market, though concerns remained about data reliability following the extended reporting delays.
1 Bureau of Labor Statistics, Gross Domestic Product, 3rd Quarter 2025 (Initial Estimate) and Corporate Profits (Preliminary),
https://www.bea.gov/news/2025/gross-domestic-product-3rd-quarter-2025-initial-estimate-and-corporate-profits
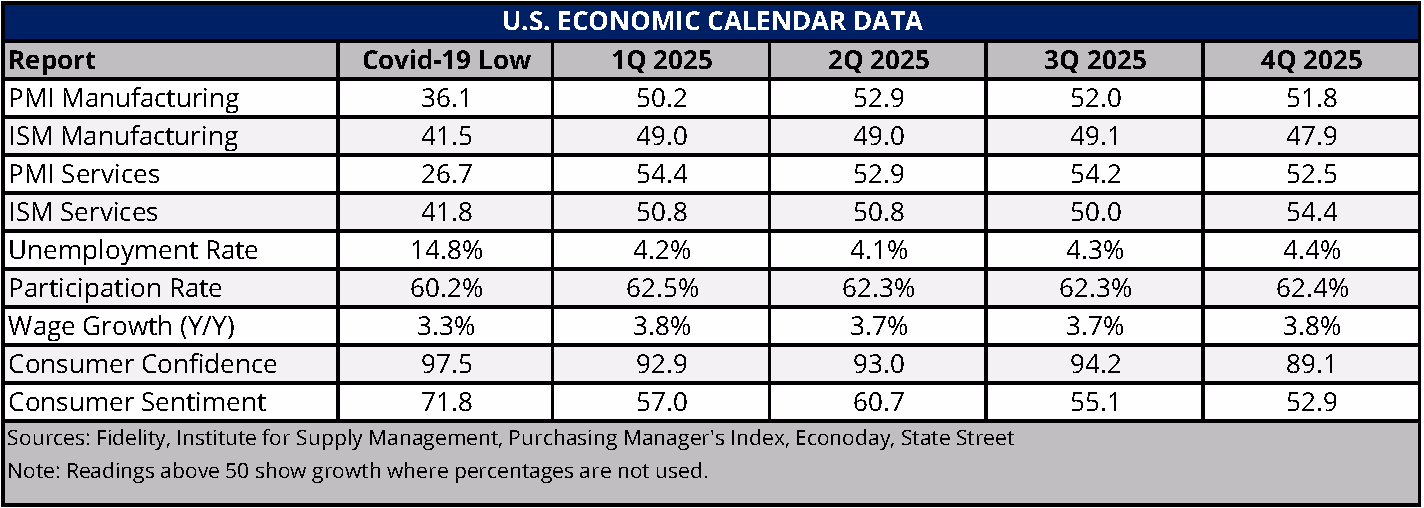
Economic Indicators
The fourth quarter delivered a mixed economic picture, marked by steady growth alongside widespread unease. Measures of Consumer Confidence iv and Consumer Sentiment v remain deeply pessimistic, levels more commonly associated with recession, as households worry about tariffs, inflation, and employment stability. Yet consumer spending continues to climb quarter over quarter, and investor behavior points to optimism, with elevated risk taking across financial markets.
Manufacturing reports vi, vii show weakness as new orders and exports have been hurt by tariffs.
On the other hand, Service reports viii, ix continue to show growth. Following a pause in releases, employment data x shows a market where unemployment has ticked up but remains resilient as hiring continues at a very selective pace due to high competition and uncertainty about the future.
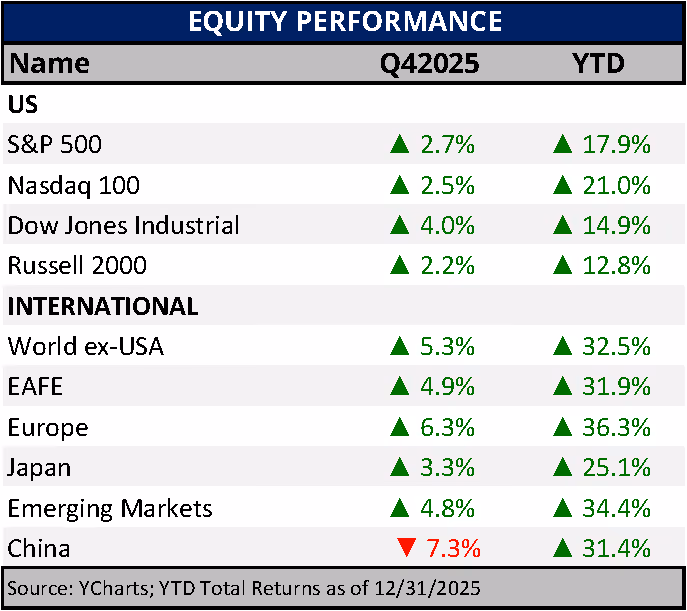
Major World Equity Market Performance for Q4 2025
Despite elevated concern throughout 2025, consumer behavior has remained resilient, with no meaningful slowdown in spending. As hard economic data continues to show growth, the gap between negative sentiment and economic reality has led many to describe the environment as a “vibecession.” Even so, the economy retains the capacity to expand, and equity markets may continue to appreciate if Artificial Intelligence related investment remains strong and corporate earnings meet expectations, though risks have increased.
Market Impact on Major Asset Classes
Impact on Equities:
The fourth quarter saw a positive finish with the S&P 500 and large-cap stocks closing the year up 17.9%. Small-cap stocks ended up double digits, as well. The U.S. market continued to benefit from strong earnings growth, while also receiving a boost from record stock buybacks that exceeded $1 trillion for the first time, and the second largest year for global M&A volume.
Outside of the U.S., international stocks in aggregate led global returns and outperformed the U.S. by roughly 15%. Developed international markets, measured by MSCI EAFE, rose 31.9% and had a strong end to the year, driven by business expansion, recovering bank lending, and improvement in Europe. The MSCI Japan Index showed encouraging growth, up 25.1% in 2025, as inflation is controlled and improved corporate governance helped unlock shareholder value.
MSCI Emerging Markets outperformed the broader developed world with a 34.4% 2025 return. And while China’s 7.3% fourth quarter decline was disappointing, the country’s 31.4% annual return shows emerging market growth was broad-based and not just a China story, as other emerging countries performed better. Many emerging market countries are exposed to and benefited from technology, increasing commodity prices, and a weakening dollar.
Looking ahead, there are reasons to remain optimistic. The U.S. economy has proven resilient, and continued earnings growth from U.S. companies is expected. At the same time, tariffs remain a risk to both growth and inflation, while lower immigration, slowing Artificial Intelligence investment, and elevated valuations could act as headwinds. Given these risks, a global perspective remains important. From a qualitative standpoint, international markets offer meaningful opportunities. China holds a leading position in robotics, manufacturing, and critical minerals. Europe is increasing defense spending, and lower inflation has allowed policy rates to remain accommodative. Japan has moved beyond deflation and has improved shareholder returns through stronger corporate governance.
From a quantitative perspective, relatively attractive valuations, improving earnings growth expectations, and the potential benefits of a weaker U.S. dollar support the case for international exposure. Taken together, these factors suggest that a globally diversified portfolio can help position investors for favorable outcomes in 2026.
Major World Equity Market Performance
for Q4 2025
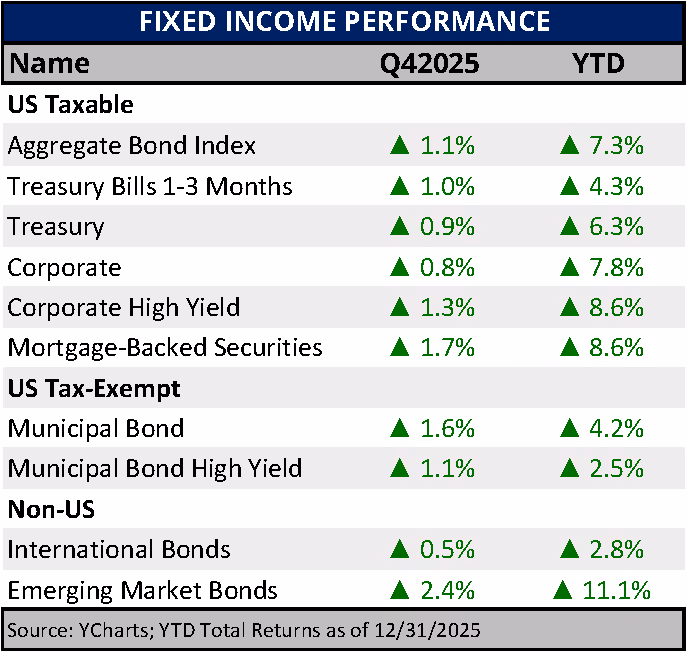
Impact on Fixed Income:
The Bloomberg U.S. Aggregate Bond Index ended 2025 on a high note returning 7.3%, a solid improvement from 2024’s 1.25% and 2023’s 5.53%. October and November posted positive returns of 0.62% each while December declined by 0.15%. Despite ongoing rate cuts at the short end of the curve, yields remained attractive throughout the year.
Corporate and Treasury bonds returned 7.8% and 6.3% respectively for the year. Municipal bonds ended the year up 4.2% supported by high demand for attractive tax equivalent yields that helped balance another record year of issuance.
Yields remain attractive looking back 15 years. Except U.S. High Yield which is in line with its historical median as seen below ii.
Yield to Worst Across Fixed Income Sectors
.avif)
Source: Bloomberg, FactSet, J.P. Morgan Credit Research, and J.P. Morgan Asset Management. Data shown represents yield to worst across fixed income sectors over the past 15 years. Yield to worst reflects the lowest potential yield assuming a bond is called or redeemed prior to maturity and all payments are made as scheduled. Past performance and historical yield ranges are not indicative of future results. Yields and market conditions are subject to change without notice. The chart illustrates historical ranges, medians, and current yields for selected fixed income sectors. Core and extended sector classifications are for illustrative purposes only and do not represent investment recommendations. Indexes are unmanaged and do not reflect the deduction of fees or expenses. Investors cannot invest directly in an index. Municipal bond yields are shown on a tax equivalent basis and assume the highest federal marginal tax rate plus applicable Medicare surtax. Credit risk, interest rate risk, liquidity risk, and other factors may affect fixed income performance. Higher yielding sectors may carry greater risk, including increased volatility and potential loss of principal. This material is provided for informational purposes only and should not be considered investment advice or a recommendation to buy or sell any security. Individual investment decisions should be made in the context of an investor’s financial situation, objectives, and risk tolerance.
Major Fixed Income Index Returns
for Q4 2025
Looking forward, yield curves are expected to steepen modestly as Federal Reserve rate cuts pull short term yields lower. Municipal bond issuance, fueled by policy uncertainty in 2025, may continue at a strong pace as borrowing costs decline. Some analysts are forecasting another record year, with issuance reaching $600 bills.
Impact on Alternatives:
With interest rates falling, private credit can offer a way to increase portfolio income with attractive risk adjusted returns relative to public credit. While asset flows into private credit products have grown dramatically over the past five years, the market itself has evolved alongside that growth. Increased scrutiny has centered on the volume of inflows and the proliferation of managers, though much of this activity has been concentrated in direct corporate lending, which represents only part of the broader market.
Unlike public bonds, which are overwhelmingly focused on corporate lending, private credit is a more robust market that also includes Asset Based Finance and Real Estate Credit, secured by financial or physical assets, as well as specialty finance in addition to established corporate lending. Real estate debt offers a way to diversify portfolios into real assets without the volatility typically associated with equity real estate exposure. As banks have retreated from real estate lending following the collapse of Silicon Valley Bank in 2023, private lenders have stepped in to fill the gap, with an estimated $2.6 trillion in real estate debt expected to require refinancing over the next three years xi.
U.S. Treasury bonds are trading with higher yields than over the past 15 years, however corporate bonds are trading much closer to historical averages. This means the “spread” or difference between the risk-free rate on Treasury bonds has narrowed and investors are receiving less compensation for taking credit risk in Investment Grade or non-Investment Grade/Junk bonds. By comparison, the spread on private credit is over 400 basis points and much closer to historical levels.
As a result, public credit markets look expensive based historical analysis of additional yield compared to incremental risk. With careful manager selection, investors willing to lock up capital for a few years can achieve favorable risk adjusted returns and higher overall yields than public bond markets. TMG favors a balanced approach across private and public credit markets.
Share of Global Private Debt Capital Raised (USD Billions) by Type
As of June 30. 2025
.avif)
Franklin Templeton Institute 2026 Private Markets Outlook
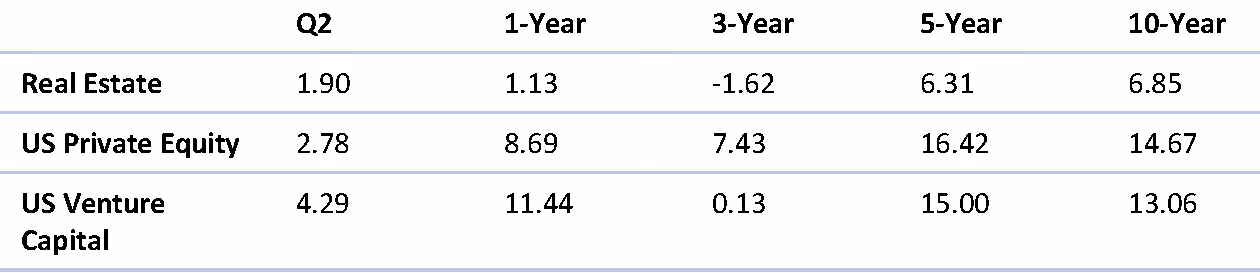
Cambridge Associates horizon index Data
as of June 30, 2025
Looking Ahead
The terms “bubble” and “AI bubble” resurfaced in headlines during the quarter as volatility in the technology sector increased and concerns emerged around elevated valuations in large-cap technology stocks. Rapid investment in Artificial Intelligence infrastructure has drawn significant attention given its remarkable growth over recent years. While comparisons to the technology or dot-com bubble of the late 1990s are understandable, the current environment reflects both similarities and important differences.
Like the internet roughly 30 years ago, Artificial Intelligence represents a transformational technology with the potential to reshape the global economy. Unlike the technology boom of the 1990s, today’s leading publicly traded AI companies are highly profitable. The S&P 500 Technology sector is currently trading at approximately 30 times forward earnings, compared to roughly 55 times earnings at the peak in 2000 xii. Businesses remain profitable today due to insatiable demand for data center capacity and any new capacity is quickly absorbed. During the 1990’s, the fiber optic networks hosting the “information superhighway” sat mostly empty in anticipation of rising demand. These “internet” companies funded the fiber buildout with heavy debt financing, frequently by the vendor selling the equipment, and were never able to repay their debt. Today’s AI infrastructure buildout has been funded largely by cashflow from profitable companies and leverage remains low. The crash 25 years ago still is fresh enough that investors appear conscious of valuation risks and focused on the risk around an investment bubble when there was very little concern in the late 90’s as valuations peaked. As with every cycle, technology will evolve and data center capacity will catch up and eventually exceed demand. Underlying fundamentals are still much healthier than the dotcom heyday over a quarter-century ago.
From a behavioral perspective, investing at all-time market highs can feel uncomfortable. The truth is that stocks rise over time as the economy grows and profits increase, making the companies contained in the index more valuable. Since 1950, the S&P 500 closed at an all-time high 1,132 times, or about once every 15 trading days. Over this 50-year period, there has been very little difference in returns between investing at all-time highs or on any other day and are within one percentage point of each other on a three- and five-year basis. Also comforting is that the chances of experiencing a correction of greater than 10% at the end of the first year after investing at an all-time high is only 9% and the market has never lost money at the end of a five-year period following an all-time high xiii. While the future is never certain, attempts to time the market by waiting for pullbacks often result in time out of the market, reducing the long-term compounding effect that has historically driven wealth creation.
Sources
i Government Shutdown by the Numbers, ABC News, November 13, 2025. https://abcnews.go.com/Business/government-shutdown-impact-numbers/story?id=127484037
ii JPMorgan Guide to the Market – December 31, 2025.
iii The New York Times “Lots of Oil, Little Production: What to Know About Venezuelan Energy” December 5, 2025
iv 2025 U.S. Economic Events & Analysis – Consumer Confidence, Econoday, 12/23/2025
v 2025 U.S. Economic Events & Analysis – Consumer Sentiment, Econoday, 12/19/2025
vi 2025 U.S. Economic Events & Analysis – ISM Manufacturing Index, Econoday, 10/3/2025
vii 2025 U.S. Economic Events & Analysis – PMI Manufacturing Final, Econoday, 10/1/2025
viii 2025 U.S. Economic Events & Analysis – PMI Composite Final, Econoday, 10/3/2025
ix 2025 U.S. Economic Events & Analysis – ISM Services Index, Econoday, 10/7/2025
x 2026 U.S. Economic Events & Analysis – Employment Situation, Econoday, 10/9/2025
xi Franklin Templeton Institute “2026 Private Markets Outlook”
xii BlackRock Advisor Center “Are we in a bubble? The AI boom in Context” – November 11, 2025
xiii RBC Global Asset Management “Investing at all-time highs” August 2025
Need more help?
Contact The Mather Group, your advisor, health insurance professional, or your state’s health insurance assistance program (SHIP) for additional information. SHIP is a national program that offers one-on-one Medicare counseling and assistance to individuals and their families.


Key Highlights to Keep You Informed
Shutdown Ends, Economic Impact Lingers
The federal government shut down on October 1 after Congress failed to pass a funding bill for the new fiscal year. Operations did not fully resume until mid-November, making it the longest shutdown on record. While much of the economic disruption was temporary, the Congressional Budget Office estimates a permanent loss of roughly $11 billion in Gross Domestic Product i. Lawmakers ultimately agreed to fund the government through January 30, 2026, requiring Congress to act again early this year to avoid another disruption.
The Fed Cut Rates
The Federal Reserve Open Market Committee cut rates twice during the quarter by 0.25% each, bringing the federal funds rate, including the September cut, to a range of 3.50% to 3.75%. While most members view easing inflation and labor market risks as justification for cuts, both decisions faced higher dissent than recent actions. Some officials remain concerned inflation is still elevated and data remains limited, while recent appointee Stephen Miran pushed for a larger 0.50% cut to respond more forcefully to slowing labor conditions.
AI Bubble Concerns Return
Continued investment in Artificial Intelligence infrastructure and rising equity markets revived concerns about a potential “AI bubble,” a theme that dominated financial headlines throughout the fourth quarter. Prominent voices, including JPMorgan Chief Executive Officer Jamie Dimon, cautioned that markets have historically overvalued transformative technologies, pointing to the Internet boom of the 1990s. Similarities include elevated valuations and heavy investment without clear paths to profitability. Key differences from the 1990s, such as meaningful cash flow generation and greater awareness of valuation risk, may help keep excesses limited.
Tariffs Ease but Stay Elevated
Trade tensions persisted but continued to ease throughout the quarter. By December 31, the average tariff rate on goods imported for consumption was estimated to be 15.6%ii. This was well below the roughly 30% rate implied by the April 8 proposals yet still represented the highest tariff level since the late 1930s.
Venezuela Strike Raises Energy Questions
A surprise U.S. military strike on Venezuela in early January 2026 resulted in the capture of President Nicolás Maduro, a move that drew strong global attention and divided international opinion. U.S. officials and some allies have argued the action will have limited short-term economic impact but could carry meaningful implications for the energy sector. Despite Venezuela holding around 17% of the world’s known oil reserves, current production has fallen to less than one million barrels per year or about 1% of the world’s energy consumption iii. Should oil production reach prior levels of over three million barrels per year prior to the country’s nationalization of the industry, sanctions and under investment in infrastructure, additional supply could put downward pressure on oil prices and boost supply for U.S. gulf coast refiners.
Quarterly Market Summary
Returns (USD), as of December 31, 2025
Notable Events in Q4:
October
The shutdown’s effects were felt across the economy, delaying key data releases and disrupting air travel as some air traffic controllers missed work. While furloughed federal employees were ultimately paid, the interruption added uncertainty early in the quarter. Despite these headwinds, equity markets advanced on strong corporate earnings, expectations for additional Federal Reserve rate cuts, and easing trade tensions. Although President Trump initially threatened to impose 100% tariffs on China in November, he reversed course mid-month, citing sustainability concerns and announcing narrower tariffs on selected goods instead.
November
The government shutdown extended through November 12, limiting economic data and adding uncertainty ahead of December’s Federal Reserve meeting. Market performance was muted, with returns largely flat for the month. Geopolitical tensions increased as the U.S. military deployed the USS Gerald R. Ford to the Caribbean, escalating its standoff with Venezuelan President Nicolás Maduro. Meanwhile, President Trump revised his reciprocal tariff proposals, removing key agricultural products such as coffee, beef, and cocoa just ahead of the Thanksgiving holiday.
December
Oil prices continued to decline, finishing the year down roughly 20%, while the Federal Open Market Committee delivered a widely expected 0.25% interest rate cut, accompanied by cautious forward guidance. The Committee’s preferred inflation measure, the Personal Consumption Expenditures Price Index, rose to 2.8% compared to 2.1% in the second quarter of 2025, with core inflation increasing to 2.9%.1 Globally, the European Central Bank held rates steady, while the Bank of Japan raised rates as part of its policy normalization efforts. Economic data released after the shutdown painted a mixed picture, with signs of moderating inflation and a softening labor market, though concerns remained about data reliability following the extended reporting delays.
1 Bureau of Labor Statistics, Gross Domestic Product, 3rd Quarter 2025 (Initial Estimate) and Corporate Profits (Preliminary),
https://www.bea.gov/news/2025/gross-domestic-product-3rd-quarter-2025-initial-estimate-and-corporate-profits
Economic Indicators
The fourth quarter delivered a mixed economic picture, marked by steady growth alongside widespread unease. Measures of Consumer Confidence iv and Consumer Sentiment v remain deeply pessimistic, levels more commonly associated with recession, as households worry about tariffs, inflation, and employment stability. Yet consumer spending continues to climb quarter over quarter, and investor behavior points to optimism, with elevated risk taking across financial markets.
Manufacturing reports vi, vii show weakness as new orders and exports have been hurt by tariffs.
On the other hand, Service reports viii, ix continue to show growth. Following a pause in releases, employment data x shows a market where unemployment has ticked up but remains resilient as hiring continues at a very selective pace due to high competition and uncertainty about the future.
Major World Equity Market Performance for Q4 2025
Despite elevated concern throughout 2025, consumer behavior has remained resilient, with no meaningful slowdown in spending. As hard economic data continues to show growth, the gap between negative sentiment and economic reality has led many to describe the environment as a “vibecession.” Even so, the economy retains the capacity to expand, and equity markets may continue to appreciate if Artificial Intelligence related investment remains strong and corporate earnings meet expectations, though risks have increased.
Market Impact on Major Asset Classes
Impact on Equities:
The fourth quarter saw a positive finish with the S&P 500 and large-cap stocks closing the year up 17.9%. Small-cap stocks ended up double digits, as well. The U.S. market continued to benefit from strong earnings growth, while also receiving a boost from record stock buybacks that exceeded $1 trillion for the first time, and the second largest year for global M&A volume.
Outside of the U.S., international stocks in aggregate led global returns and outperformed the U.S. by roughly 15%. Developed international markets, measured by MSCI EAFE, rose 31.9% and had a strong end to the year, driven by business expansion, recovering bank lending, and improvement in Europe. The MSCI Japan Index showed encouraging growth, up 25.1% in 2025, as inflation is controlled and improved corporate governance helped unlock shareholder value.
MSCI Emerging Markets outperformed the broader developed world with a 34.4% 2025 return. And while China’s 7.3% fourth quarter decline was disappointing, the country’s 31.4% annual return shows emerging market growth was broad-based and not just a China story, as other emerging countries performed better. Many emerging market countries are exposed to and benefited from technology, increasing commodity prices, and a weakening dollar.
Looking ahead, there are reasons to remain optimistic. The U.S. economy has proven resilient, and continued earnings growth from U.S. companies is expected. At the same time, tariffs remain a risk to both growth and inflation, while lower immigration, slowing Artificial Intelligence investment, and elevated valuations could act as headwinds. Given these risks, a global perspective remains important. From a qualitative standpoint, international markets offer meaningful opportunities. China holds a leading position in robotics, manufacturing, and critical minerals. Europe is increasing defense spending, and lower inflation has allowed policy rates to remain accommodative. Japan has moved beyond deflation and has improved shareholder returns through stronger corporate governance.
From a quantitative perspective, relatively attractive valuations, improving earnings growth expectations, and the potential benefits of a weaker U.S. dollar support the case for international exposure. Taken together, these factors suggest that a globally diversified portfolio can help position investors for favorable outcomes in 2026.
Major World Equity Market Performance
for Q4 2025
Impact on Fixed Income:
The Bloomberg U.S. Aggregate Bond Index ended 2025 on a high note returning 7.3%, a solid improvement from 2024’s 1.25% and 2023’s 5.53%. October and November posted positive returns of 0.62% each while December declined by 0.15%. Despite ongoing rate cuts at the short end of the curve, yields remained attractive throughout the year.
Corporate and Treasury bonds returned 7.8% and 6.3% respectively for the year. Municipal bonds ended the year up 4.2% supported by high demand for attractive tax equivalent yields that helped balance another record year of issuance.
Yields remain attractive looking back 15 years. Except U.S. High Yield which is in line with its historical median as seen below ii.
Yield to Worst Across Fixed Income Sectors
Source: Bloomberg, FactSet, J.P. Morgan Credit Research, and J.P. Morgan Asset Management. Data shown represents yield to worst across fixed income sectors over the past 15 years. Yield to worst reflects the lowest potential yield assuming a bond is called or redeemed prior to maturity and all payments are made as scheduled. Past performance and historical yield ranges are not indicative of future results. Yields and market conditions are subject to change without notice. The chart illustrates historical ranges, medians, and current yields for selected fixed income sectors. Core and extended sector classifications are for illustrative purposes only and do not represent investment recommendations. Indexes are unmanaged and do not reflect the deduction of fees or expenses. Investors cannot invest directly in an index. Municipal bond yields are shown on a tax equivalent basis and assume the highest federal marginal tax rate plus applicable Medicare surtax. Credit risk, interest rate risk, liquidity risk, and other factors may affect fixed income performance. Higher yielding sectors may carry greater risk, including increased volatility and potential loss of principal. This material is provided for informational purposes only and should not be considered investment advice or a recommendation to buy or sell any security. Individual investment decisions should be made in the context of an investor’s financial situation, objectives, and risk tolerance.
Major Fixed Income Index Returns
for Q4 2025
Looking forward, yield curves are expected to steepen modestly as Federal Reserve rate cuts pull short term yields lower. Municipal bond issuance, fueled by policy uncertainty in 2025, may continue at a strong pace as borrowing costs decline. Some analysts are forecasting another record year, with issuance reaching $600 bills.
Impact on Alternatives:
With interest rates falling, private credit can offer a way to increase portfolio income with attractive risk adjusted returns relative to public credit. While asset flows into private credit products have grown dramatically over the past five years, the market itself has evolved alongside that growth. Increased scrutiny has centered on the volume of inflows and the proliferation of managers, though much of this activity has been concentrated in direct corporate lending, which represents only part of the broader market.
Unlike public bonds, which are overwhelmingly focused on corporate lending, private credit is a more robust market that also includes Asset Based Finance and Real Estate Credit, secured by financial or physical assets, as well as specialty finance in addition to established corporate lending. Real estate debt offers a way to diversify portfolios into real assets without the volatility typically associated with equity real estate exposure. As banks have retreated from real estate lending following the collapse of Silicon Valley Bank in 2023, private lenders have stepped in to fill the gap, with an estimated $2.6 trillion in real estate debt expected to require refinancing over the next three years xi.
U.S. Treasury bonds are trading with higher yields than over the past 15 years, however corporate bonds are trading much closer to historical averages. This means the “spread” or difference between the risk-free rate on Treasury bonds has narrowed and investors are receiving less compensation for taking credit risk in Investment Grade or non-Investment Grade/Junk bonds. By comparison, the spread on private credit is over 400 basis points and much closer to historical levels.
As a result, public credit markets look expensive based historical analysis of additional yield compared to incremental risk. With careful manager selection, investors willing to lock up capital for a few years can achieve favorable risk adjusted returns and higher overall yields than public bond markets. TMG favors a balanced approach across private and public credit markets.
Share of Global Private Debt Capital Raised (USD Billions) by Type
As of June 30. 2025
Franklin Templeton Institute 2026 Private Markets Outlook
Cambridge Associates horizon index Data
as of June 30, 2025
Looking Ahead
The terms “bubble” and “AI bubble” resurfaced in headlines during the quarter as volatility in the technology sector increased and concerns emerged around elevated valuations in large-cap technology stocks. Rapid investment in Artificial Intelligence infrastructure has drawn significant attention given its remarkable growth over recent years. While comparisons to the technology or dot-com bubble of the late 1990s are understandable, the current environment reflects both similarities and important differences.
Like the internet roughly 30 years ago, Artificial Intelligence represents a transformational technology with the potential to reshape the global economy. Unlike the technology boom of the 1990s, today’s leading publicly traded AI companies are highly profitable. The S&P 500 Technology sector is currently trading at approximately 30 times forward earnings, compared to roughly 55 times earnings at the peak in 2000 xii. Businesses remain profitable today due to insatiable demand for data center capacity and any new capacity is quickly absorbed. During the 1990’s, the fiber optic networks hosting the “information superhighway” sat mostly empty in anticipation of rising demand. These “internet” companies funded the fiber buildout with heavy debt financing, frequently by the vendor selling the equipment, and were never able to repay their debt. Today’s AI infrastructure buildout has been funded largely by cashflow from profitable companies and leverage remains low. The crash 25 years ago still is fresh enough that investors appear conscious of valuation risks and focused on the risk around an investment bubble when there was very little concern in the late 90’s as valuations peaked. As with every cycle, technology will evolve and data center capacity will catch up and eventually exceed demand. Underlying fundamentals are still much healthier than the dotcom heyday over a quarter-century ago.
From a behavioral perspective, investing at all-time market highs can feel uncomfortable. The truth is that stocks rise over time as the economy grows and profits increase, making the companies contained in the index more valuable. Since 1950, the S&P 500 closed at an all-time high 1,132 times, or about once every 15 trading days. Over this 50-year period, there has been very little difference in returns between investing at all-time highs or on any other day and are within one percentage point of each other on a three- and five-year basis. Also comforting is that the chances of experiencing a correction of greater than 10% at the end of the first year after investing at an all-time high is only 9% and the market has never lost money at the end of a five-year period following an all-time high xiii. While the future is never certain, attempts to time the market by waiting for pullbacks often result in time out of the market, reducing the long-term compounding effect that has historically driven wealth creation.
Sources
i Government Shutdown by the Numbers, ABC News, November 13, 2025. https://abcnews.go.com/Business/government-shutdown-impact-numbers/story?id=127484037
ii JPMorgan Guide to the Market – December 31, 2025.
iii The New York Times “Lots of Oil, Little Production: What to Know About Venezuelan Energy” December 5, 2025
iv 2025 U.S. Economic Events & Analysis – Consumer Confidence, Econoday, 12/23/2025
v 2025 U.S. Economic Events & Analysis – Consumer Sentiment, Econoday, 12/19/2025
vi 2025 U.S. Economic Events & Analysis – ISM Manufacturing Index, Econoday, 10/3/2025
vii 2025 U.S. Economic Events & Analysis – PMI Manufacturing Final, Econoday, 10/1/2025
viii 2025 U.S. Economic Events & Analysis – PMI Composite Final, Econoday, 10/3/2025
ix 2025 U.S. Economic Events & Analysis – ISM Services Index, Econoday, 10/7/2025
x 2026 U.S. Economic Events & Analysis – Employment Situation, Econoday, 10/9/2025
xi Franklin Templeton Institute “2026 Private Markets Outlook”
xii BlackRock Advisor Center “Are we in a bubble? The AI boom in Context” – November 11, 2025
xiii RBC Global Asset Management “Investing at all-time highs” August 2025
Need more help?
Contact The Mather Group, your advisor, health insurance professional, or your state’s health insurance assistance program (SHIP) for additional information. SHIP is a national program that offers one-on-one Medicare counseling and assistance to individuals and their families.
.avif)