Market updates

Second Quarter 2026 Market Returns: S&P 500 Sectors & Asset Classes

‍

June 17, 2026

In today's dynamic market, the factors driving returns are ever-changing. Our latest analysis underscores the value of a well-diversified portfolio by highlighting recent performance trends across S&P 500 sectors and asset classes. Explore the charts below to gain deeper insights into these trends and optimize your investment strategy with our expert guidance.
‍

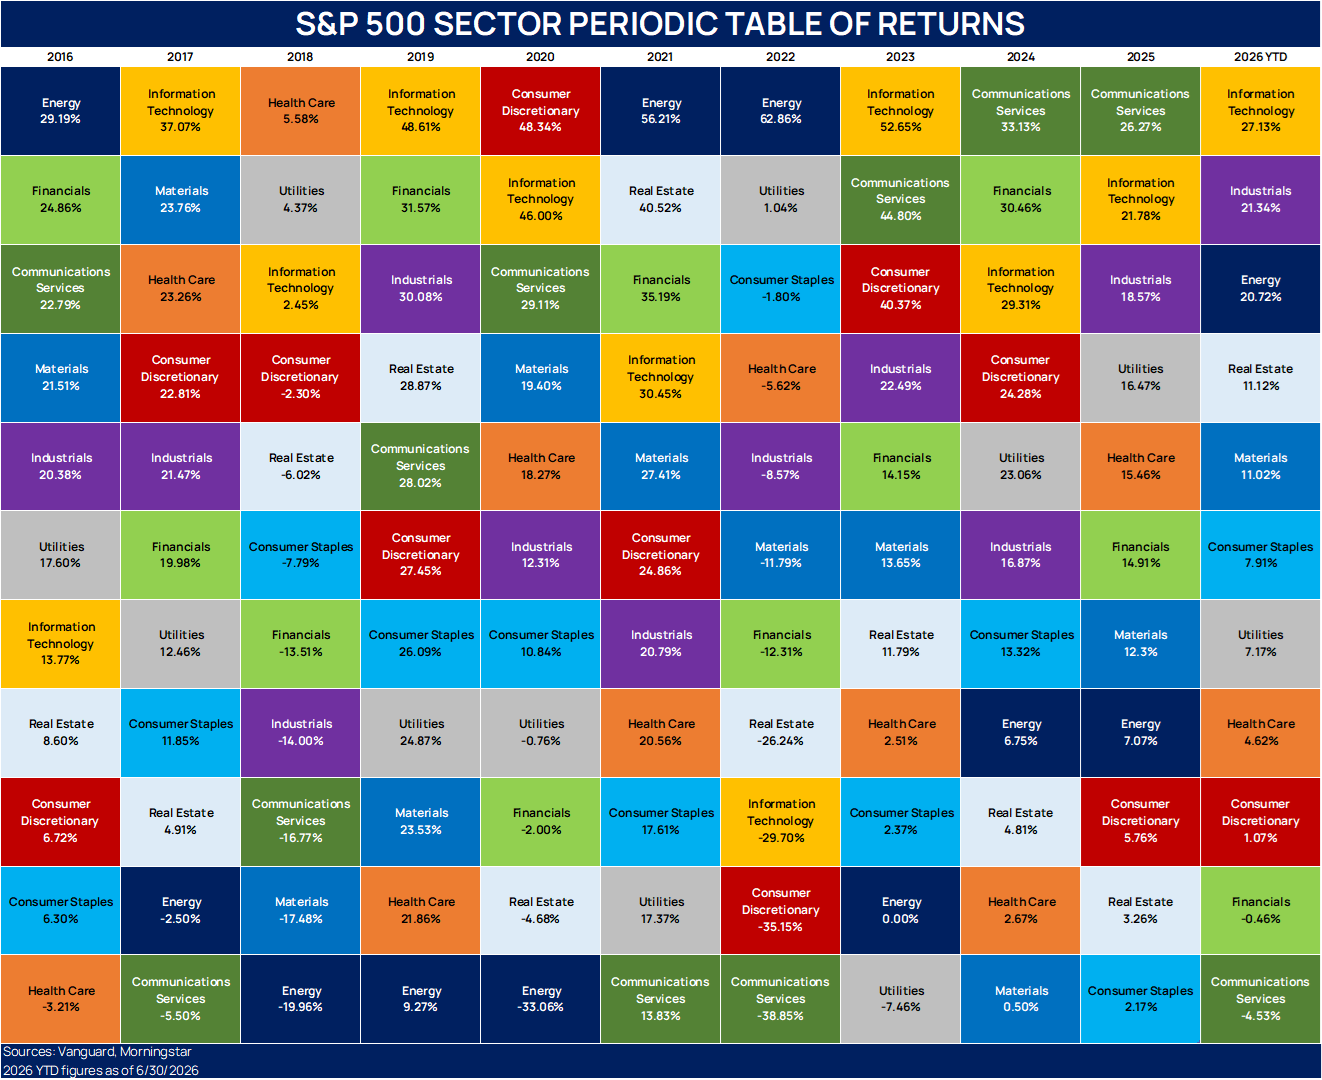
S&P 500 SECTOR PERIODIC TABLE OF RETURNS
(2016 - 2026)

This chart contains the 11 sectors that constitute the S&P 500 Index. Each sector is given a unique color, and each column is organized from highest return (top) to lowest return (bottom), for a given year. The first 10 columns display annual performance for each sector from 2016 to 2025. The last column on the right illustrates year-to-date (YTD) performance, as of June 30th, 2026.

2026 YTD Leaders:

  • Information Technology = 27.13%
  • Industrials = 21.34%
  • Energy = 20.72%
    ‍

2026 YTD Laggards:

  • Consumer Discretionary = 1.07%
  • Financials = -0.46%
  • Communications Services = -4.53%


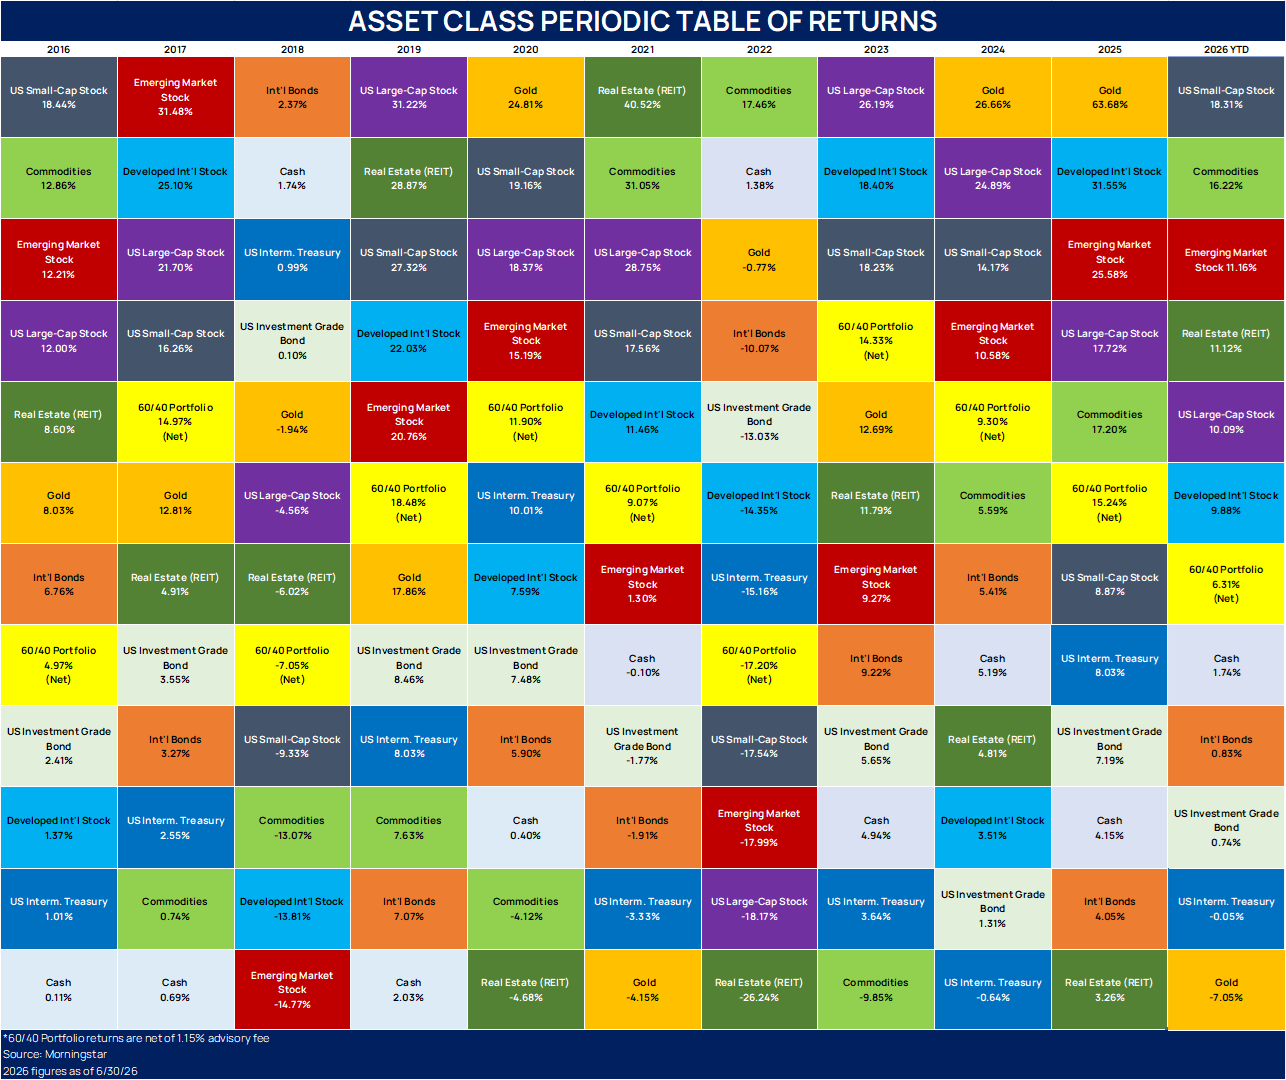
ASSET CLASS PERIODIC TABLE OF RETURNS
(2016 – 2026)

This chart is composed of 11 standard asset classes and an example of a diversified 60% stock and 40% bond portfolio. Each asset class is given a unique color, and each column is organized from highest return (top) to lowest return (bottom), for a given year. The 60/40 portfolio (in bright yellow) generally falls somewhere in the middle, helping to illustrate how a diversified portfolio can reduce volatility. The first 10 columns display annual performance for each asset class from 2016 to 2025. The last column on the right illustrates year-to-date (YTD) performance, as of June 30th, 2026.
‍

2026 YTD Leaders:

  • US Small-Cap Stock = 18.31%
  • Commodities = 16.22%
  • Emerging Market Stocks = 11.16%

2026 YTD Laggards:

  • Investment Grade Bond = 0.74%
  • U.S. Intermediate Treasury = -0.05%
  • Gold = -7.05%

Please feel free to reach out to us with any questions.

‍

Need more help?
Contact The Mather Group, your advisor, health insurance professional, or your state’s health insurance assistance program (SHIP) for additional information. SHIP is a national program that offers one-on-one Medicare counseling and assistance to individuals and their families.

In today's dynamic market, the factors driving returns are ever-changing. Our latest analysis underscores the value of a well-diversified portfolio by highlighting recent performance trends across S&P 500 sectors and asset classes. Explore the charts below to gain deeper insights into these trends and optimize your investment strategy with our expert guidance.
‍

S&P 500 SECTOR PERIODIC TABLE OF RETURNS
(2016 - 2026)

This chart contains the 11 sectors that constitute the S&P 500 Index. Each sector is given a unique color, and each column is organized from highest return (top) to lowest return (bottom), for a given year. The first 10 columns display annual performance for each sector from 2016 to 2025. The last column on the right illustrates year-to-date (YTD) performance, as of June 30th, 2026.

2026 YTD Leaders:

  • Information Technology = 27.13%
  • Industrials = 21.34%
  • Energy = 20.72%
    ‍

2026 YTD Laggards:

  • Consumer Discretionary = 1.07%
  • Financials = -0.46%
  • Communications Services = -4.53%


ASSET CLASS PERIODIC TABLE OF RETURNS
(2016 – 2026)

This chart is composed of 11 standard asset classes and an example of a diversified 60% stock and 40% bond portfolio. Each asset class is given a unique color, and each column is organized from highest return (top) to lowest return (bottom), for a given year. The 60/40 portfolio (in bright yellow) generally falls somewhere in the middle, helping to illustrate how a diversified portfolio can reduce volatility. The first 10 columns display annual performance for each asset class from 2016 to 2025. The last column on the right illustrates year-to-date (YTD) performance, as of June 30th, 2026.
‍

2026 YTD Leaders:

  • US Small-Cap Stock = 18.31%
  • Commodities = 16.22%
  • Emerging Market Stocks = 11.16%

2026 YTD Laggards:

  • Investment Grade Bond = 0.74%
  • U.S. Intermediate Treasury = -0.05%
  • Gold = -7.05%

Please feel free to reach out to us with any questions.

‍

Need more help?
Contact The Mather Group, your advisor, health insurance professional, or your state’s health insurance assistance program (SHIP) for additional information. SHIP is a national program that offers one-on-one Medicare counseling and assistance to individuals and their families.
Let’s build your financial future today.
Experience purpose-driven financial management designed around you and your family. Get a free investment audit today to discover the TMG difference.
Start with a free financial consultation.
Market updates

Second Quarter 2026 Market Returns: S&P 500 Sectors & Asset Classes

‍

June 17, 2026

In today's dynamic market, the factors driving returns are ever-changing. Our latest analysis underscores the value of a well-diversified portfolio by highlighting recent performance trends across S&P 500 sectors and asset classes. Explore the charts below to gain deeper insights into these trends and optimize your investment strategy with our expert guidance.
‍

S&P 500 SECTOR PERIODIC TABLE OF RETURNS
(2016 - 2026)

This chart contains the 11 sectors that constitute the S&P 500 Index. Each sector is given a unique color, and each column is organized from highest return (top) to lowest return (bottom), for a given year. The first 10 columns display annual performance for each sector from 2016 to 2025. The last column on the right illustrates year-to-date (YTD) performance, as of June 30th, 2026.

2026 YTD Leaders:

  • Information Technology = 27.13%
  • Industrials = 21.34%
  • Energy = 20.72%
    ‍

2026 YTD Laggards:

  • Consumer Discretionary = 1.07%
  • Financials = -0.46%
  • Communications Services = -4.53%


ASSET CLASS PERIODIC TABLE OF RETURNS
(2016 – 2026)

This chart is composed of 11 standard asset classes and an example of a diversified 60% stock and 40% bond portfolio. Each asset class is given a unique color, and each column is organized from highest return (top) to lowest return (bottom), for a given year. The 60/40 portfolio (in bright yellow) generally falls somewhere in the middle, helping to illustrate how a diversified portfolio can reduce volatility. The first 10 columns display annual performance for each asset class from 2016 to 2025. The last column on the right illustrates year-to-date (YTD) performance, as of June 30th, 2026.
‍

2026 YTD Leaders:

  • US Small-Cap Stock = 18.31%
  • Commodities = 16.22%
  • Emerging Market Stocks = 11.16%

2026 YTD Laggards:

  • Investment Grade Bond = 0.74%
  • U.S. Intermediate Treasury = -0.05%
  • Gold = -7.05%

Please feel free to reach out to us with any questions.

‍

Need more help?
Contact The Mather Group, your advisor, health insurance professional, or your state’s health insurance assistance program (SHIP) for additional information. SHIP is a national program that offers one-on-one Medicare counseling and assistance to individuals and their families.

In today's dynamic market, the factors driving returns are ever-changing. Our latest analysis underscores the value of a well-diversified portfolio by highlighting recent performance trends across S&P 500 sectors and asset classes. Explore the charts below to gain deeper insights into these trends and optimize your investment strategy with our expert guidance.
‍

S&P 500 SECTOR PERIODIC TABLE OF RETURNS
(2016 - 2026)

This chart contains the 11 sectors that constitute the S&P 500 Index. Each sector is given a unique color, and each column is organized from highest return (top) to lowest return (bottom), for a given year. The first 10 columns display annual performance for each sector from 2016 to 2025. The last column on the right illustrates year-to-date (YTD) performance, as of June 30th, 2026.

2026 YTD Leaders:

  • Information Technology = 27.13%
  • Industrials = 21.34%
  • Energy = 20.72%
    ‍

2026 YTD Laggards:

  • Consumer Discretionary = 1.07%
  • Financials = -0.46%
  • Communications Services = -4.53%


ASSET CLASS PERIODIC TABLE OF RETURNS
(2016 – 2026)

This chart is composed of 11 standard asset classes and an example of a diversified 60% stock and 40% bond portfolio. Each asset class is given a unique color, and each column is organized from highest return (top) to lowest return (bottom), for a given year. The 60/40 portfolio (in bright yellow) generally falls somewhere in the middle, helping to illustrate how a diversified portfolio can reduce volatility. The first 10 columns display annual performance for each asset class from 2016 to 2025. The last column on the right illustrates year-to-date (YTD) performance, as of June 30th, 2026.
‍

2026 YTD Leaders:

  • US Small-Cap Stock = 18.31%
  • Commodities = 16.22%
  • Emerging Market Stocks = 11.16%

2026 YTD Laggards:

  • Investment Grade Bond = 0.74%
  • U.S. Intermediate Treasury = -0.05%
  • Gold = -7.05%

Please feel free to reach out to us with any questions.

‍

Need more help?
Contact The Mather Group, your advisor, health insurance professional, or your state’s health insurance assistance program (SHIP) for additional information. SHIP is a national program that offers one-on-one Medicare counseling and assistance to individuals and their families.
Let’s build your
financial future today.
Experience purpose-driven financial management designed around you and your family. Get a free investment audit today to discover the TMG difference.
Start with a free financial consultation.