Market Update | Third Quarter 2025
October 23, 2025
Key Highlights to Keep You Informed
Employment Weakness Raises Growth Concerns
Employment data softened through the third quarter, with job creation falling below expectations and raising questions about the strength of the economy. For the first two months of the quarter, the economy created about 95,000 jobs per month compared with consensus forecasts of roughly 155,000. In addition, previously reported job gains over the past 12 months were revised lower by approximately 900,000.
The September jobs report was delayed due to the government shutdown, but the ADP private payroll report suggested further deterioration in hiring trends.
Inflation Remains Elevated
Inflation showed signs of reacceleration as the Consumer Price Index (CPI) trended higher for several months, reaching a 2.9% year-over-year increase in August. This remains above the Federal Reserve’s 2% target and reflects continued pricing pressure across goods and services.
The Fed Shifts Toward Easier Policy
In response to a weaker labor market and slowing momentum, the Federal Reserve cut interest rates for the first time this year at its September meeting, lowering the policy rate by 0.25% to a range of 4.00 to 4.25%. While inflation has remained elevated, policymakers emphasized growing downside risks to the economy.
Chair Powell noted that the outlook remains uncertain and signaled that additional rate cuts are likely depending on upcoming economic data. The updated “dot plot” now projects another 0.50% in potential cuts by year-end.
Government Shutdown Adds Short-Term Uncertainty
At midnight on October 1, the federal government shut down after Congress was unable to agree on a funding bill for fiscal year 2026. Although Republicans hold a majority in both the House and Senate, legislation requires 60 votes in the Senate to advance, necessitating bipartisan support. The primary point of contention involves subsidies under the Affordable Care Act.
While shutdowns can weigh on near-term growth as federal employees and contractors temporarily lose pay and reduce spending, much of the economic impact is typically recouped once operations resume. Historical data shows that equity markets have often remained resilient or even posted gains during previous shutdowns, including the record 35-day closure that began in December 2018.
Quarterly Market Summary
Returns (USD), as of September 30, 2025
.avif)
Past performance is not a guarantee of future results. Indices are not available for direct investment. Index performance does not reflect the expenses associated with the management of an actual portfolio.
Market segment (index representation) as follows: U.S. Stock Market (Russell 3000 Index), International Developed Stocks (MSCI World ex USA Index [net dividends]), Emerging Markets (MSCI Emerging Markets Index [net dividends]), Global Real Estate (S&P Global REIT Index [net dividends]), U.S. Bond Market (Bloomberg U.S. Aggregate Bond Index), and Global Bond Market ex U.S. (Bloomberg Global Aggregate ex-USD Bond Index [hedged to USD]). S&P data © 2025 S&P Dow Jones Indices LLC, a division of S&P Global. All rights reserved. Frank Russell Company is the source and owner of the trademarks, service marks, and copyrights related to the Russell Indexes. MSCI data © MSCI 2025, all rights reserved. Bloomberg data provided by Bloomberg.
Notable Events in Q3:
July
On July 4, the “One Big Beautiful Bill” was signed into law, making the 2017 individual tax cuts permanent and raising the state and local tax (SALT) deduction cap from $10,000 to $40,000 for households earning under $500,000. Later in the month, trade tensions resurfaced as the 90-day tariff pause expired. The U.S. imposed a 15% tariff on most European Union goods and reached a temporary truce with China to extend its tariff deadline by another 90 days. New trade frameworks were also announced with Japan, Indonesia, the Philippines, South Korea, the United Kingdom, and Vietnam. The second-quarter GDP estimate showed a 3.0% rebound after a 0.5% decline in the first quarter, largely driven by shifting import activity around anticipated tariffs.
August
Geopolitical tensions continued to dominate headlines as the conflicts in Ukraine and Gaza persisted. Following the expiration of the tariff pause, the United States resumed trade duties on multiple partners, prompting criticism from countries such as India and Brazil.
Domestically, the labor market continued to show signs of cooling, prompting renewed political pressure on the Federal Reserve. While inflation remained above target, policymakers faced increasing calls to balance price stability with employment risks.
September
Investor attention in September centered on the Federal Open Market Committee (FOMC) meeting. Core PCE inflation edged up to 2.9% in July from 2.8% in June, while August job growth came in well below expectations, with only 22,000 new jobs versus forecasts of 77,000. This marked the fourth straight month of weak hiring, and unemployment rose to 4.3%.
Despite slightly higher inflation, the Fed cut rates by 0.25%, citing a softening labor market as the greater risk to the economy. Policymakers expect tariff and immigration impacts to fade over time, with inflation projected to ease gradually through 2026 and approach the Fed’s 2% target by 2027.
Economic Indicators
Economic data in the third quarter shows a resilient economy, but one at risk of stagflation, and one that market participants are feeling concerned about according to both the Consumer Confidence i and Consumer Sentiment ii surveys. Both reports continue to show concern about tariffs, inflation, and job-related worries. However, the wealthiest Americans remain relatively positive about the economy as the stock market continues to rise, and per Moody’s, the top 10% of U.S. earners are now accounting for 50% of consumer spending. Manufacturing reports, iii, iv show a low and slowing growth sector, where prices for inputs and end goods are increasing. Employment market data is less helpful, given it is delayed with the government shutdown. v However, it is believed to be relatively stable at an expected 4.3% unemployment rate. Importantly, the service sector continues to expand, but there are growing signs of stagnation and rising inflation. vi,vii
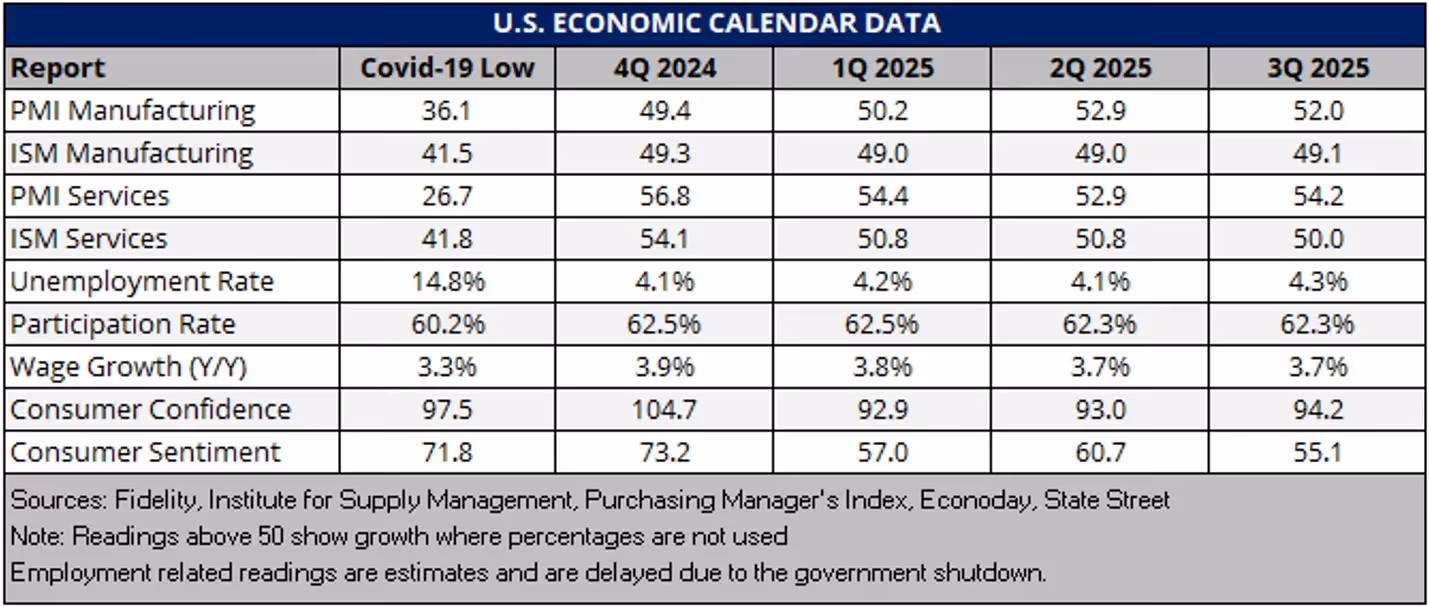
i. 2025 U.S. Economic Events & Analysis – Consumer Confidence, Econoday, 9/30/2025
ii. 2025 U.S. Economic Events & Analysis – Consumer Sentiment, Econoday, 9/10/2025
iii. 2025 U.S. Economic Events & Analysis – ISM Manufacturing Index, Econoday, 10/3/2025
iv. 2025 U.S. Economic Events & Analysis – PMI Manufacturing Final, Econoday, 10/1/2025
v. 2025 U.S. Economic Events & Analysis – Employment Situation, Econoday, 10/3/2025
vi. 2025 U.S. Economic Events & Analysis – PMI Composite Final, Econoday, 10/3/2025
vii. 2025 U.S. Economic Events & Analysis – ISM Services Index, Econoday, 10/3/2025
Tariffs continue to be the key risk to continued growth, and a potential catalyst for inflation. Despite those risks, the Fed recently delivered a 0.25% rate cut as what is viewed as a “risk management” cut to support the economy. Given they must balance controlling inflation and maintaining maximum employment, the Fed remains in an unenviable position. However, the economy has potential to run as hard economic data such as GDP remains bolstered by elevated A.I. related spending, and strong corporate earnings from tech, that have masked weakness elsewhere.
Market Impact on Major Asset Classes
Impact on Equities:
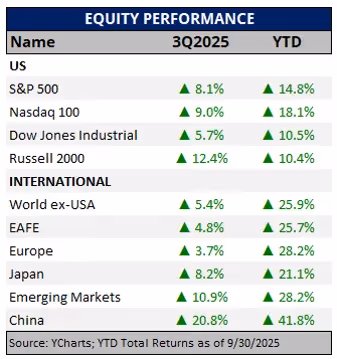
The third quarter saw a strong rally from the S&P 500 with large-cap stocks rising 8.1%, driven by a technology stock rebound and are up 14.8% on the year. Small-cap stocks also benefited from falling interest rates, leading to a strong 12.4% return in the quarter. Much like the broader economy, A.I. related spending and investment continues to serve as a key catalyst for growth.
Outside of the U.S., international stocks lagged the U.S. market in the quarter but continue to outperform U.S. markets by about 10% in 2025. Developed international markets, measured by MSCI EAFE, were up 5.4% for the quarter. Much of Europe was weaker with Germany declining, but a resilient world economy was enough to support overall returns.
The MSCI Japan Index showed Japan was one of the stronger developed market areas, up 8.2% in Q3, as inflation remains manageable, and optimism increased due to a favorable trade deal with the U.S., where the tariff rate was lowered from 25% to 15%.
MSCI Emerging Markets continues to outperform the developed world with a 28.2% YTD return, driven in part by China’s strong 20.8% quarterly return. In many ways it seems history has repeated itself as previous tariff conflicts saw strong returns from China and their current year to date return is over 40%. Easing trade tensions, and government support for chipmakers and technology companies helped propel the surge in returns. Despite the positives, China is still grappling with deflationary pressures, generated by low consumer confidence and excess supply of goods caused by extreme domestic competition.
Looking ahead, trade tensions remain a risk, as do persistent geopolitical issues. Despite those issues, we continue to see increased value from international diversification given potential tailwinds from improving earnings, a weakening dollar, and improved sentiment around investing abroad. Additionally, investing overseas helps mitigate concentration risk as a handful of companies in the U.S. are increasingly responsible for most of the index return.
As we look ahead, our team remains forward-looking and prepared for the possibility that focusing on the past winners may not be prudent as valuations rise, despite strong earnings. Periods of volatility are to be expected, so it remains vital to stick to a well-thought-out plan especially when risks are elevated.
Major World Equity Market Performance for Q3 2025
Impact on Fixed Income:
The Bloomberg U.S. Aggregate Bond Index posted solid returns in August and September of 1.2% and 1.1% respectively that outweighed July’s underperformance, ending the quarter up 2% and up 6.1% year-to-date. September got a boost from the Fed’s rate cut pushing short-term yields down and prices higher.
.avif)
Munis finally showed signs of life this year after struggling to outpace a constant stream of new issuance (up 14% through September compared to 2024). The Bloomberg Municipal Bond Index returned 3% for the quarter vs. 2.6% and 1.5% for Corporates and Treasuries, respectively.
Expectations for the Fed’s rate cut drove short term Treasury and Muni yields lower steepening both curves. While the Fed can directly influence short term rates, long term rates may not move in tandem and in some cases drift in the opposite direction. In 2024 the Fed cut rates by 100 basis points from Sept 18th – Dec 18th, however intermediate and long-term Treasury rates rose by 88 basis points and 75 basis points respectively by the end of the year.
In a decreasing rate environment, owning individual bonds can provide some stability in income compared to leaving funds in a money market. A laddered bond approach locks in yields across the curve while a short-term money market would start to see decreasing yields shortly after a rate cut.
Credit remains healthy in both the Corporate and Muni spaces. Reaching for High Yield, in either, is not attractive as spreads remain tight, providing little return for the added risk, especially with the continued uncertainty of tariffs, the weaker labor market, and delayed data collection/reporting.
Major Fixed Income Index Returns for Q3 2025
.avif)
Impact on Alternatives:
Since peaking at approximately 8,800 publicly listed companies in 1997, the number of companies publicly traded in the U.S. has been in steady decline, recently falling below 4,000 listed companies. viii There are several factors driving this trend. First, less companies are choosing to become public and remaining private as long as possible. Increased regulations for publicly listed companies, such as the Sarbanes-Oxley Act of 2002 and Dodd-Frank in 2010, make it more expensive to operate as a public company. The desire to focus on execution of long-term goals over quarterly earnings targets has also led executives to prefer private capital over public markets. In addition to staying private longer, public companies are taking themselves private. Video game maker Electronic Arts is one of the most recent public companies to go private in a $55 billion buyout.
As a result, public markets are becoming more concentrated and less diversified. Concentration among the very largest companies dominates the size and return of most stock indexes, with the top 10 companies in the S&P 500 accounting for 37.8% of assets ix. For investors that stick to only public markets, the result is less true diversification and returns heavily driven by a few names, more systematic or market risk, and more exposure to higher valuations that are subject to volatility. An allocation to private equity can increase diversification to a broader portion of the economy, including the next generation of technology leaders and established mid-sized companies with strong cash flows and growth that would have been public in prior generations. Please see important disclosure below.
Cambridge Associates horizon index data as of March 31, 2025
.png)
viii. Bloomberg: Forbes “The Decline in U.S. Stocks to Chose From: What in Means for Investors” February 3, 2025
ix. Yahoo Finance 10/3/2025
Alternative Investments carry a higher degree of risk related to illiquidity, valuation, and lack of a public market where they can be bought and sold. Investing in Alternative Investments carries the risk of loss to some or all of your principal investment. Alternative Investments that fall under Rule 506 Regulation D of the Investment Company Act of 1940 (“the Act”) are considered unregistered funds, and therefore, are not regulated in the same way as a registered fund under the Act. Depending on the type of investment, a prospective investor must prequalify as an Accredited Investor or Qualified Purchaser under Rule 506 or Qualified Client defined under Rule 205-3 of the Investment Advisers Act of 1940 before investing. Please carefully review the investment’s Private Placement Memorandum (PPM) and/or other Offering Documents and Disclosures before investing in an Alternative Investment.
Looking Ahead
Uncertainty remains elevated as key economic indicators send mixed signals. Inflation has shown signs of reaccelerating, the Federal Reserve’s next steps on interest rates remain unclear, and U.S. stocks continue to push toward record highs. Despite a weak first quarter, Gross Domestic Product (GDP) still points to a resilient economy, though this strength contrasts with softer employment data. The disconnect may reflect shifting immigration patterns that have reduced workforce growth, technological advances such as Artificial Intelligence replacing certain roles, or a lag in how GDP captures real-time economic activity.
Recent inflation pressure appears linked to higher tariffs, as prices for goods like vehicles, furniture, and apparel have increased. This dynamic complicates the Fed’s dual mandate of maintaining stable prices and full employment, leaving policymakers in a challenging position as they weigh whether to support the job market with lower rates or fight inflation through tighter policy.
At the same time, equity markets have remained strong, with valuations climbing as investors anticipate potential rate cuts later this year. While predicting market movements is impossible, it is worth remembering the words of Peter Lynch: “More money has been lost by investors trying to anticipate corrections than has been lost in the corrections themselves.”
Rather than attempting to time the market, maintaining a globally diversified portfolio remains the most effective way to manage risk and capture opportunity. Diversification across asset classes, sectors, and regions helps ensure that when one area of the market slows, another may provide stability or growth. For instance, slowing business activity can weigh on stocks but benefit bonds, while higher inflation often pressures bonds but supports equities and real assets.
Although uncertainty can be uncomfortable, it often creates new long-term opportunities. The most reliable path through any market environment is staying disciplined, diversified, and aligned with your plan. Your TMG Advisor can help you assess your current allocation, strengthen portfolio resilience, and identify strategies to benefit from shifting market trends.
Need more help?
Contact The Mather Group, your advisor, health insurance professional, or your state’s health insurance assistance program (SHIP) for additional information. SHIP is a national program that offers one-on-one Medicare counseling and assistance to individuals and their families.


Key Highlights to Keep You Informed
Employment Weakness Raises Growth Concerns
Employment data softened through the third quarter, with job creation falling below expectations and raising questions about the strength of the economy. For the first two months of the quarter, the economy created about 95,000 jobs per month compared with consensus forecasts of roughly 155,000. In addition, previously reported job gains over the past 12 months were revised lower by approximately 900,000.
The September jobs report was delayed due to the government shutdown, but the ADP private payroll report suggested further deterioration in hiring trends.
Inflation Remains Elevated
Inflation showed signs of reacceleration as the Consumer Price Index (CPI) trended higher for several months, reaching a 2.9% year-over-year increase in August. This remains above the Federal Reserve’s 2% target and reflects continued pricing pressure across goods and services.
The Fed Shifts Toward Easier Policy
In response to a weaker labor market and slowing momentum, the Federal Reserve cut interest rates for the first time this year at its September meeting, lowering the policy rate by 0.25% to a range of 4.00 to 4.25%. While inflation has remained elevated, policymakers emphasized growing downside risks to the economy.
Chair Powell noted that the outlook remains uncertain and signaled that additional rate cuts are likely depending on upcoming economic data. The updated “dot plot” now projects another 0.50% in potential cuts by year-end.
Government Shutdown Adds Short-Term Uncertainty
At midnight on October 1, the federal government shut down after Congress was unable to agree on a funding bill for fiscal year 2026. Although Republicans hold a majority in both the House and Senate, legislation requires 60 votes in the Senate to advance, necessitating bipartisan support. The primary point of contention involves subsidies under the Affordable Care Act.
While shutdowns can weigh on near-term growth as federal employees and contractors temporarily lose pay and reduce spending, much of the economic impact is typically recouped once operations resume. Historical data shows that equity markets have often remained resilient or even posted gains during previous shutdowns, including the record 35-day closure that began in December 2018.
Quarterly Market Summary
Returns (USD), as of September 30, 2025
Past performance is not a guarantee of future results. Indices are not available for direct investment. Index performance does not reflect the expenses associated with the management of an actual portfolio.
Market segment (index representation) as follows: U.S. Stock Market (Russell 3000 Index), International Developed Stocks (MSCI World ex USA Index [net dividends]), Emerging Markets (MSCI Emerging Markets Index [net dividends]), Global Real Estate (S&P Global REIT Index [net dividends]), U.S. Bond Market (Bloomberg U.S. Aggregate Bond Index), and Global Bond Market ex U.S. (Bloomberg Global Aggregate ex-USD Bond Index [hedged to USD]). S&P data © 2025 S&P Dow Jones Indices LLC, a division of S&P Global. All rights reserved. Frank Russell Company is the source and owner of the trademarks, service marks, and copyrights related to the Russell Indexes. MSCI data © MSCI 2025, all rights reserved. Bloomberg data provided by Bloomberg.
Notable Events in Q3:
July
On July 4, the “One Big Beautiful Bill” was signed into law, making the 2017 individual tax cuts permanent and raising the state and local tax (SALT) deduction cap from $10,000 to $40,000 for households earning under $500,000. Later in the month, trade tensions resurfaced as the 90-day tariff pause expired. The U.S. imposed a 15% tariff on most European Union goods and reached a temporary truce with China to extend its tariff deadline by another 90 days. New trade frameworks were also announced with Japan, Indonesia, the Philippines, South Korea, the United Kingdom, and Vietnam. The second-quarter GDP estimate showed a 3.0% rebound after a 0.5% decline in the first quarter, largely driven by shifting import activity around anticipated tariffs.
August
Geopolitical tensions continued to dominate headlines as the conflicts in Ukraine and Gaza persisted. Following the expiration of the tariff pause, the United States resumed trade duties on multiple partners, prompting criticism from countries such as India and Brazil.
Domestically, the labor market continued to show signs of cooling, prompting renewed political pressure on the Federal Reserve. While inflation remained above target, policymakers faced increasing calls to balance price stability with employment risks.
September
Investor attention in September centered on the Federal Open Market Committee (FOMC) meeting. Core PCE inflation edged up to 2.9% in July from 2.8% in June, while August job growth came in well below expectations, with only 22,000 new jobs versus forecasts of 77,000. This marked the fourth straight month of weak hiring, and unemployment rose to 4.3%.
Despite slightly higher inflation, the Fed cut rates by 0.25%, citing a softening labor market as the greater risk to the economy. Policymakers expect tariff and immigration impacts to fade over time, with inflation projected to ease gradually through 2026 and approach the Fed’s 2% target by 2027.
Economic Indicators
Economic data in the third quarter shows a resilient economy, but one at risk of stagflation, and one that market participants are feeling concerned about according to both the Consumer Confidence i and Consumer Sentiment ii surveys. Both reports continue to show concern about tariffs, inflation, and job-related worries. However, the wealthiest Americans remain relatively positive about the economy as the stock market continues to rise, and per Moody’s, the top 10% of U.S. earners are now accounting for 50% of consumer spending. Manufacturing reports, iii, iv show a low and slowing growth sector, where prices for inputs and end goods are increasing. Employment market data is less helpful, given it is delayed with the government shutdown. v However, it is believed to be relatively stable at an expected 4.3% unemployment rate. Importantly, the service sector continues to expand, but there are growing signs of stagnation and rising inflation. vi,vii
i. 2025 U.S. Economic Events & Analysis – Consumer Confidence, Econoday, 9/30/2025
ii. 2025 U.S. Economic Events & Analysis – Consumer Sentiment, Econoday, 9/10/2025
iii. 2025 U.S. Economic Events & Analysis – ISM Manufacturing Index, Econoday, 10/3/2025
iv. 2025 U.S. Economic Events & Analysis – PMI Manufacturing Final, Econoday, 10/1/2025
v. 2025 U.S. Economic Events & Analysis – Employment Situation, Econoday, 10/3/2025
vi. 2025 U.S. Economic Events & Analysis – PMI Composite Final, Econoday, 10/3/2025
vii. 2025 U.S. Economic Events & Analysis – ISM Services Index, Econoday, 10/3/2025
Tariffs continue to be the key risk to continued growth, and a potential catalyst for inflation. Despite those risks, the Fed recently delivered a 0.25% rate cut as what is viewed as a “risk management” cut to support the economy. Given they must balance controlling inflation and maintaining maximum employment, the Fed remains in an unenviable position. However, the economy has potential to run as hard economic data such as GDP remains bolstered by elevated A.I. related spending, and strong corporate earnings from tech, that have masked weakness elsewhere.
Market Impact on Major Asset Classes
Impact on Equities:
The third quarter saw a strong rally from the S&P 500 with large-cap stocks rising 8.1%, driven by a technology stock rebound and are up 14.8% on the year. Small-cap stocks also benefited from falling interest rates, leading to a strong 12.4% return in the quarter. Much like the broader economy, A.I. related spending and investment continues to serve as a key catalyst for growth.
Outside of the U.S., international stocks lagged the U.S. market in the quarter but continue to outperform U.S. markets by about 10% in 2025. Developed international markets, measured by MSCI EAFE, were up 5.4% for the quarter. Much of Europe was weaker with Germany declining, but a resilient world economy was enough to support overall returns.
The MSCI Japan Index showed Japan was one of the stronger developed market areas, up 8.2% in Q3, as inflation remains manageable, and optimism increased due to a favorable trade deal with the U.S., where the tariff rate was lowered from 25% to 15%.
MSCI Emerging Markets continues to outperform the developed world with a 28.2% YTD return, driven in part by China’s strong 20.8% quarterly return. In many ways it seems history has repeated itself as previous tariff conflicts saw strong returns from China and their current year to date return is over 40%. Easing trade tensions, and government support for chipmakers and technology companies helped propel the surge in returns. Despite the positives, China is still grappling with deflationary pressures, generated by low consumer confidence and excess supply of goods caused by extreme domestic competition.
Looking ahead, trade tensions remain a risk, as do persistent geopolitical issues. Despite those issues, we continue to see increased value from international diversification given potential tailwinds from improving earnings, a weakening dollar, and improved sentiment around investing abroad. Additionally, investing overseas helps mitigate concentration risk as a handful of companies in the U.S. are increasingly responsible for most of the index return.
As we look ahead, our team remains forward-looking and prepared for the possibility that focusing on the past winners may not be prudent as valuations rise, despite strong earnings. Periods of volatility are to be expected, so it remains vital to stick to a well-thought-out plan especially when risks are elevated.
Major World Equity Market Performance for Q3 2025
Impact on Fixed Income:
The Bloomberg U.S. Aggregate Bond Index posted solid returns in August and September of 1.2% and 1.1% respectively that outweighed July’s underperformance, ending the quarter up 2% and up 6.1% year-to-date. September got a boost from the Fed’s rate cut pushing short-term yields down and prices higher.
Munis finally showed signs of life this year after struggling to outpace a constant stream of new issuance (up 14% through September compared to 2024). The Bloomberg Municipal Bond Index returned 3% for the quarter vs. 2.6% and 1.5% for Corporates and Treasuries, respectively.
Expectations for the Fed’s rate cut drove short term Treasury and Muni yields lower steepening both curves. While the Fed can directly influence short term rates, long term rates may not move in tandem and in some cases drift in the opposite direction. In 2024 the Fed cut rates by 100 basis points from Sept 18th – Dec 18th, however intermediate and long-term Treasury rates rose by 88 basis points and 75 basis points respectively by the end of the year.
In a decreasing rate environment, owning individual bonds can provide some stability in income compared to leaving funds in a money market. A laddered bond approach locks in yields across the curve while a short-term money market would start to see decreasing yields shortly after a rate cut.
Credit remains healthy in both the Corporate and Muni spaces. Reaching for High Yield, in either, is not attractive as spreads remain tight, providing little return for the added risk, especially with the continued uncertainty of tariffs, the weaker labor market, and delayed data collection/reporting.
Major Fixed Income Index Returns for Q3 2025
Impact on Alternatives:
Since peaking at approximately 8,800 publicly listed companies in 1997, the number of companies publicly traded in the U.S. has been in steady decline, recently falling below 4,000 listed companies. viii There are several factors driving this trend. First, less companies are choosing to become public and remaining private as long as possible. Increased regulations for publicly listed companies, such as the Sarbanes-Oxley Act of 2002 and Dodd-Frank in 2010, make it more expensive to operate as a public company. The desire to focus on execution of long-term goals over quarterly earnings targets has also led executives to prefer private capital over public markets. In addition to staying private longer, public companies are taking themselves private. Video game maker Electronic Arts is one of the most recent public companies to go private in a $55 billion buyout.
As a result, public markets are becoming more concentrated and less diversified. Concentration among the very largest companies dominates the size and return of most stock indexes, with the top 10 companies in the S&P 500 accounting for 37.8% of assets ix. For investors that stick to only public markets, the result is less true diversification and returns heavily driven by a few names, more systematic or market risk, and more exposure to higher valuations that are subject to volatility. An allocation to private equity can increase diversification to a broader portion of the economy, including the next generation of technology leaders and established mid-sized companies with strong cash flows and growth that would have been public in prior generations. Please see important disclosure below.
Cambridge Associates horizon index data as of March 31, 2025
viii. Bloomberg: Forbes “The Decline in U.S. Stocks to Chose From: What in Means for Investors” February 3, 2025
ix. Yahoo Finance 10/3/2025
Alternative Investments carry a higher degree of risk related to illiquidity, valuation, and lack of a public market where they can be bought and sold. Investing in Alternative Investments carries the risk of loss to some or all of your principal investment. Alternative Investments that fall under Rule 506 Regulation D of the Investment Company Act of 1940 (“the Act”) are considered unregistered funds, and therefore, are not regulated in the same way as a registered fund under the Act. Depending on the type of investment, a prospective investor must prequalify as an Accredited Investor or Qualified Purchaser under Rule 506 or Qualified Client defined under Rule 205-3 of the Investment Advisers Act of 1940 before investing. Please carefully review the investment’s Private Placement Memorandum (PPM) and/or other Offering Documents and Disclosures before investing in an Alternative Investment.
Looking Ahead
Uncertainty remains elevated as key economic indicators send mixed signals. Inflation has shown signs of reaccelerating, the Federal Reserve’s next steps on interest rates remain unclear, and U.S. stocks continue to push toward record highs. Despite a weak first quarter, Gross Domestic Product (GDP) still points to a resilient economy, though this strength contrasts with softer employment data. The disconnect may reflect shifting immigration patterns that have reduced workforce growth, technological advances such as Artificial Intelligence replacing certain roles, or a lag in how GDP captures real-time economic activity.
Recent inflation pressure appears linked to higher tariffs, as prices for goods like vehicles, furniture, and apparel have increased. This dynamic complicates the Fed’s dual mandate of maintaining stable prices and full employment, leaving policymakers in a challenging position as they weigh whether to support the job market with lower rates or fight inflation through tighter policy.
At the same time, equity markets have remained strong, with valuations climbing as investors anticipate potential rate cuts later this year. While predicting market movements is impossible, it is worth remembering the words of Peter Lynch: “More money has been lost by investors trying to anticipate corrections than has been lost in the corrections themselves.”
Rather than attempting to time the market, maintaining a globally diversified portfolio remains the most effective way to manage risk and capture opportunity. Diversification across asset classes, sectors, and regions helps ensure that when one area of the market slows, another may provide stability or growth. For instance, slowing business activity can weigh on stocks but benefit bonds, while higher inflation often pressures bonds but supports equities and real assets.
Although uncertainty can be uncomfortable, it often creates new long-term opportunities. The most reliable path through any market environment is staying disciplined, diversified, and aligned with your plan. Your TMG Advisor can help you assess your current allocation, strengthen portfolio resilience, and identify strategies to benefit from shifting market trends.
Need more help?
Contact The Mather Group, your advisor, health insurance professional, or your state’s health insurance assistance program (SHIP) for additional information. SHIP is a national program that offers one-on-one Medicare counseling and assistance to individuals and their families.
.avif)