Market Update | Third Quarter 2026
October 20, 2026
Key Highlights to Keep You Informed
Interest rates climbed sharply this quarter, driven by higher oil prices, persistent inflation and a Federal Reserve (Fed) rate hike. Stocks still finished higher on the back of strong corporate earnings, while bonds lost value in the short term but now offer some of the most attractive yields in nearly two decades.
Rising Interest Rates
A global bond market selloff pushed interest rates higher, raising borrowing costs for businesses and consumers alike. The move began with the collapse of the Iran ceasefire, which sent oil prices up and renewed inflation concerns.
The Federal Reserve held short-term rates steady in July, but market pressure kept pushing long-term yields higher. In August, the U.S. Treasury tried to ease that pressure by buying long-term bonds in the open market; the effort proved ineffective. In September, the Fed raised its policy rate by 0.25 percentage points to help contain inflation.
Why it matters: Long-term rates set the cost of mortgages and corporate borrowing. The 30-year Treasury yield ended the quarter at 5.6%, its highest level since 2001.
The National Debt Passes $40 Trillion
The U.S. national debt surpassed $40 trillion for the first time, a notable milestone that drew significant attention in August. While the headline figure itself is less meaningful over time, given economic growth and inflation, debt sustainability is more commonly assessed relative to the size of the economy.
By that measure, Federal debt stands at roughly 123% of GDP, the highest since World War II. After the war, the ratio fell for decades to about 30% in the early 1980s before trending higher again. For comparison, Japan's debt-to-GDP ratio is estimated at more than 200%. Some market participants have attributed rising interest rates in part to increased debt issuance by the U.S. government, as well as elevated borrowing by corporations investing in AI-related infrastructure.
Inflation and the Midterm Elections
Inflation has reemerged as acentral issue heading into the midterm elections. Fueled largely by energyprices, both the Consumer Price Index and the Federal Reserve’s preferredmeasure, the Personal Consumption Expenditures (PCE) price index, rose to 3.4%,well above the Fed’s 2% target. Core inflation, which excludes food and energy,remains more contained at 2.4%, suggesting price pressures are concentratedrather than broad-based. The Fed raised rates a quarter point in September andsignaled one more increase is likely before year-end.
A recent Pew Research Center surveyfound the economy and cost of living are voters’ leading concerns. If theelection were held today, 43% of respondents would support a Democraticcandidate and 37% a Republican candidate, with a meaningful share still undecided.i
Regardless of the outcome, midtermelections have historically brought elevated market volatility leading up toElection Day, followed by strong equity performance in the year after. TheS&P 500 has delivered positive returns in the 12 months following everymidterm election since 1950, with an average gain of approximately 14% to 15%.ii For investors, that history makes a casefor staying disciplined through the headlines.
Quarterly Market Summary
Returns (USD), as of September 30, 2026
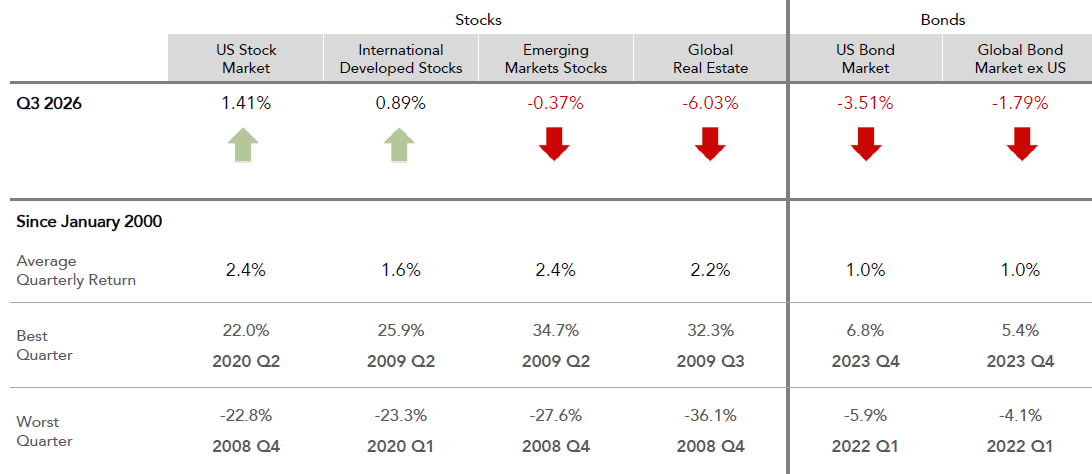
Past performance is not a guarantee of future results. Indices are not available for direct investment. Index performance does not reflect the expenses associated with the management of an actual portfolio.
Market segment (indexrepresentation) as follows: US Stock Market (Russell 3000 Index), InternationalDeveloped Stocks (MSCI World ex USA Index [net dividends]), Emerging Markets(MSCI Emerging Markets Index [net dividends]), Global Real Estate (S&PGlobal REIT Index [net dividends]), US Bond Market (Bloomberg US Aggregate BondIndex), and Global Bond Market ex US (Bloomberg Global Aggregate ex-USD BondIndex [hedged to USD]). S&P data © 2026 S&P Dow Jones Indices LLC, adivision of S&P Global. All rights reserved. Frank Russell Company is thesource and owner of the trademarks, service marks, and copy rights related tothe Russell Indexes. MSCI data © MSCI 2026, all rights reserved. Bloomberg dataprovided by Bloomberg.
Notable Events in Q3:
July
Hopes for a peace agreement with Iran and the reopening of the Strait of Hormuz faded after the Islamabad Memorandum formally collapsed on July 8. Brent crude (the global oil benchmark) rose 20.2% for the month, briefly topping $102 per barrel. The resulting inflation worries lifted the 30-year Treasury yield to 5.27% by month-end, its highest since July 2001. The Fed nonetheless left short-term rates unchanged.
August
The S&P 500 reached new all-time highs in the first half of the month before pulling back, with energy companies providing a boost as hostilities near the Strait of Hormuz resumed. The U.S. Treasury Department confirmed the national debt had more than doubled in less than a decade. Together with sticky inflation, that milestone contributed to a more hawkish Fed (one leaning toward higher rates to fight inflation).
September
On September 16, the Federal Open Market Committee, the Fed’s rate-setting body, voted unanimously to raise the federal funds rate to a range of 3.75%–4.00%. The decision reflected inflation running above the Fed’s 2% target alongside healthy economic data.
Markets had largely expected the hike, so the immediate reaction was modest: Treasury yields rose an average of 0.03 percentage points, mostly in short-term bonds, which are most sensitive to Fed moves. Chair Warsh’s speech after the announcement reassured markets that the Fed is focused on controlling inflation and remains independent.
Month-end Treasury yields rose sharply across the curve with the 10-year increasing by 50bps and the 30-year rising by 37bps to 5.6%, the highest since 2001iii. The 30-year mortgage rate, which tracks the 10-year Treasury inched up above 7% for the first time in a year.
Economic Indicators
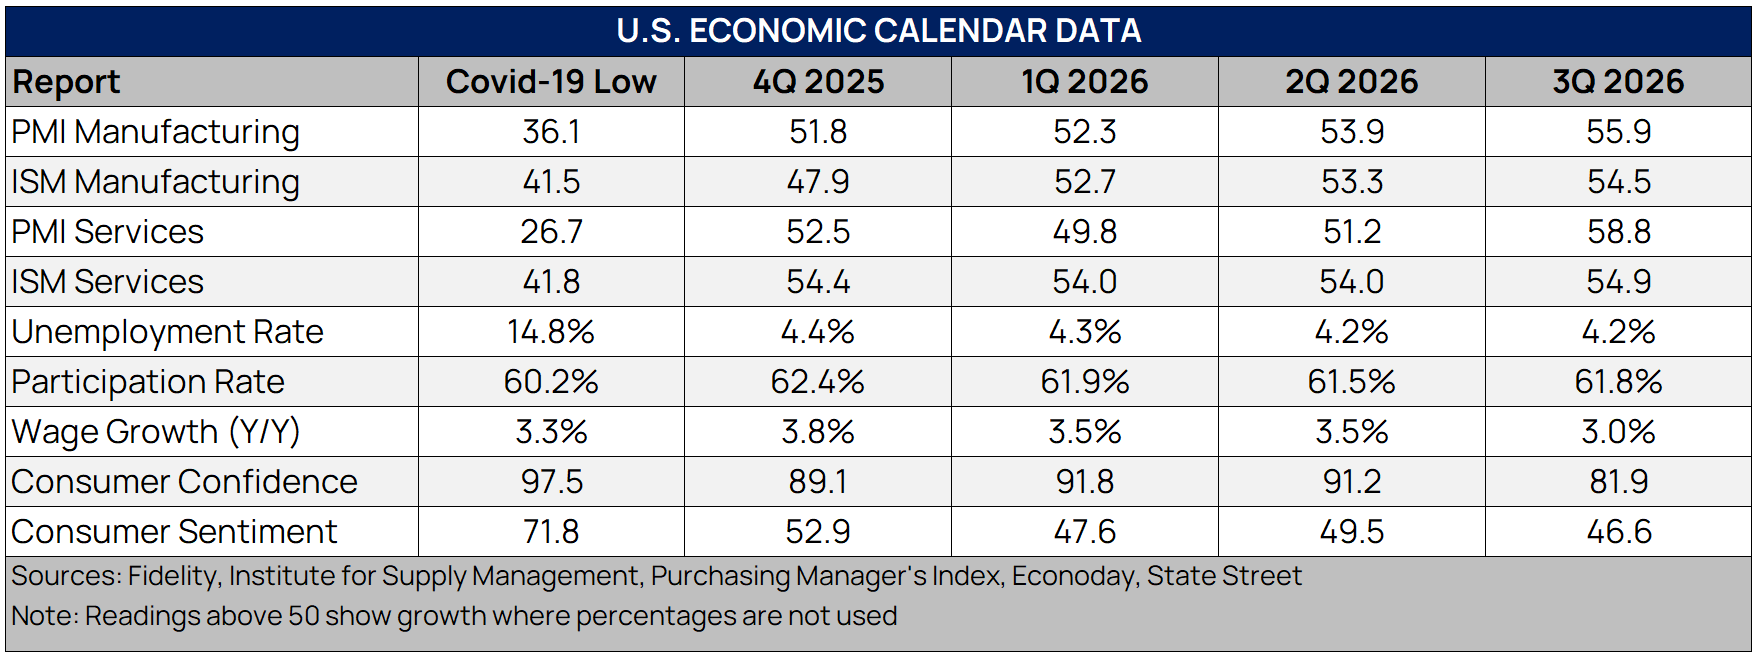
The third quarter saw continued conflict in the Middle East and resulting pressure on global supply chains, especially energy. As a result, measures of Consumer Confidenceiv and Consumer Sentimentv continue to worsen, as higher financing costs, inflation and geopolitical tensions remain concerns. Despite these headwinds, employment datavi show continued resilience, though with some underlying softness and slowing wage growth that will give the Fed pause when considering additional rate hikes.
Manufacturing reportsvii,viii continue to show growth, driven by the ongoing AI construction boom and a willingness to hire more workers. However, prices increased due to inflationary pressures and supply-chain issues. Service industriesix,x also show continued growth but are contending with the same inflationary and tariff-related forces seen in the manufacturing sector.
Overall, despite very negative sentiment readings, consumers continue to spend at a growing rate, though luxury goods saw a pullback. Beyond consumer spending, U.S. economic data remain resilient, with both the manufacturing and service sectors growing. Given this resilience and the structural tailwinds from AI-related capital expenditures, many continue to see the risk of a U.S. recession as low.
Market Impact on Major Asset Classes
Impact on Equities:
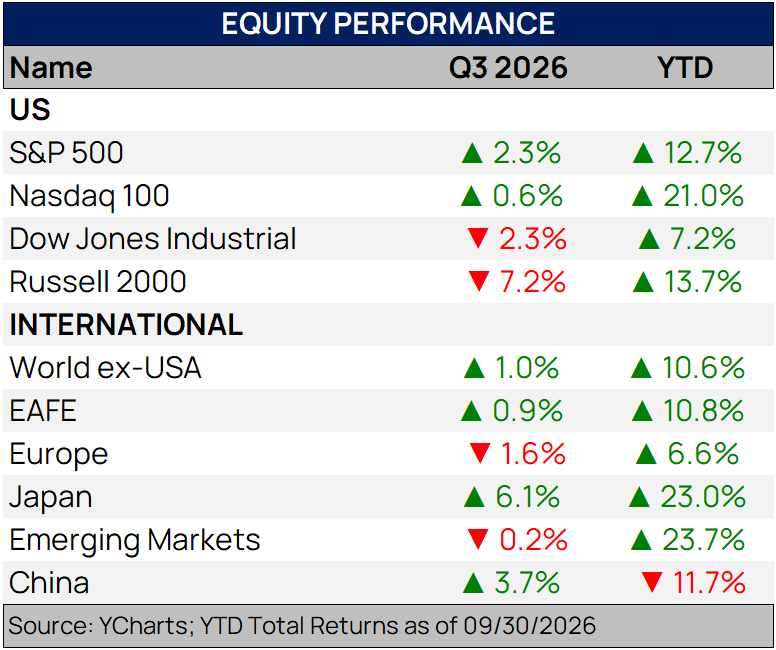
The third quarter brought continued market appreciation, with energy and technology stocks leading U.S. large caps higher. According to Nasdaq, gains were concentrated in a small handful of companies: 83% of S&P 500 constituents fell at least 10% from their 52-week highs, and 42% fell more than 20%. While large-cap stocks did relatively well, small-cap stocks, as measured by the Russell 2000, declined in the quarter but are still outperforming larger companies for the year. As with large caps, technology and energy companies have led the way within small-cap indexes.
International stocks also continued to perform well. The MSCI Emerging Markets Index was mostly flat, though China rose nearly 4%. China’s recovery was driven by technology, though the country is still contending with weak domestic consumer demand. Latin America, India and Middle Eastern countries were disproportionately affected by the oil shock and higher U.S. rates.
Developed international markets, as measured by the MSCI EAFE Index, rose but struggled with higher energy prices. Despite inflationary pressure, both the European Central Bank and the Bank of England kept policy rates stable. Industrial output remains stagnant, but, as in the U.S., earnings have been resilient and growing.
The MSCI Japan Index was a standout, outperforming most of the world. Although the Bank of Japan raised rates, corporate fundamentals remain solid, with FactSet estimating that Japanese earnings rose nearly 30% year over year. Robotics and semiconductor companies contributed to strong performance, while reforms and labor shortages drove wages higher. While consumers have more spending power, they remain cautious due to higher energy prices.
Despite geopolitical risk, inflation and rising rates, global markets enter the fourth quarter backed by strong earnings, which have made valuations more reasonable. The AI build-out is both the market’s key opportunity and its key risk: AI spending has been a powerful driver but returns that fall short could weigh on markets. We continue to favor broad global diversification that doesn’t rely solely on AI beneficiaries.
Major World Equity Market Performance
for Q3 2026
Impact on Fixed Income:
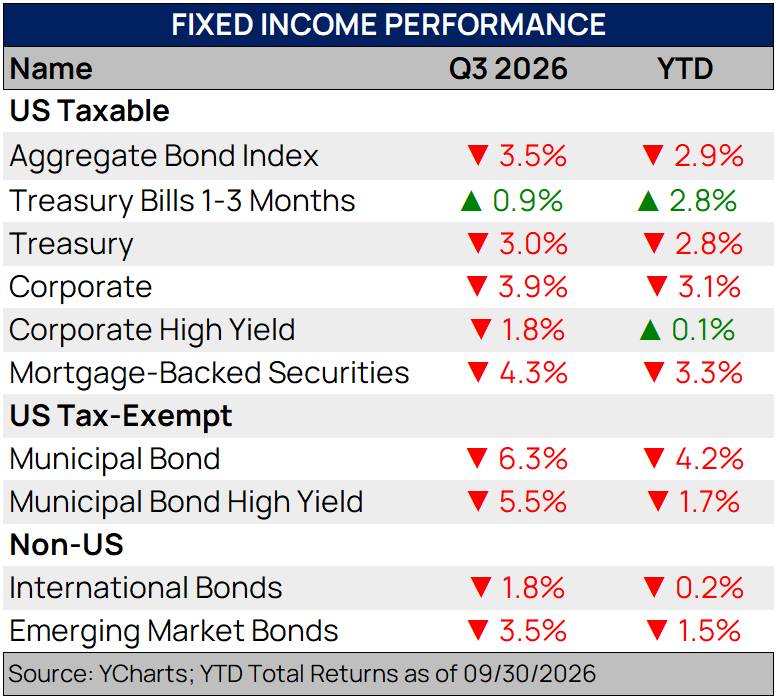
Bond yields climbed sharply over the quarter, driven by uncertainty over Fed policy ahead of its September meeting, persistent inflation, mounting concern over the U.S. debt-to-GDP ratio, and the war in Iran. Municipal bonds bore the brunt of the selloff, declining 6.3% for the quarter, with most of the damage coming in September (–4.36%). Treasuries fell 3% over the quarter and are now down 2.8% year to date. The Fed raised short-term interest rates this quarter, but long-term bonds saw an even bigger shift. Investors sold longer-dated Treasuries, pushing their yields higher and widening the gap between 2-year and 10-year rates by about 0.10%. Corporate bond credit spreads rose to 84 basis points, their highest level since April 2026, but remained well below long-term averages.
Rising yields put pressure on existing bondholders, since bond prices move in the opposite direction of yields. For investors looking to add individual bonds, however, the selloff has created an attractive opportunity to lock in today’s higher rates. For an investor in the top federal bracket (37% plus the 3.8% net investment income tax), the tax-equivalent yield on a 5-year AAA municipal bond rose from 4.4% at the start of the quarter to 6.6% by September 30. Holding bonds to maturity also removes much of the concern over interim price swings, whether investors are building a ladder matched to known future cash needs or a 10-year ladder that spreads interest-rate risk over time.
Tax-loss harvesting in fixed income can also help offset some equity gains. Investors can sell a portion of their individual bonds or bond funds to realize losses while also taking gains in the equity portion of their portfolio. The fixed income losses can help reduce the tax bill on equity gains. In addition, proceeds from equities could be shifted to fixed income to take advantage of the higher yields described above.
TMG recommends a shorter duration (earlier maturities) to reduce interest-rate risk and maintains a preference for high-quality, investment-grade bonds to limit credit risk.
Major Fixed Income Index Returns
for Q3 2026
Impact on Alternatives:
Higher interest rates have created challenges for real estate, an asset class often viewed as a partial substitute for fixed income. As with bonds, rising interest rates generally put downward pressure on property values, as higher yields require lower asset prices to remain attractive. In addition, elevated rates increase financing costs for property owners and investors.
Despite these headwinds, real estate has historically provided a degree of protection against inflation. Following the sharp rise in interest rates beginning in 2022, new construction activity slowed significantly as higher borrowing costs made many development projects uneconomical. Over time, reduced construction can constrain the supply of apartments, retail space and industrial properties, strengthening landlords’ ability to raise rents.
Many investors initially anticipated a rapid recovery in real estate as interest rates normalized after 2022. While that outcome has not materialized, the sector’s longer-term fundamentals appear to be improving. Slower new supply growth is helping create a more favorable balance between supply and demand, supporting future rent growth and reinforcing real estate’s inflation-hedging characteristics.
Real estate debt may be particularly attractive in the current environment. As higher interest rates and lower property valuations have pressured borrowers, lenders have gained greater negotiating power and can command higher loan yields, potentially offering a more compelling risk-adjusted return profile than equity investments in the sector.
Cambridge Associates horizon index Data
as of March 31, 2026

Private-market index returns arereported with a lag; these figures predate the 2026 rise in interest ratesdiscussed above.
Alternative Investments carry ahigher degree of risk related to illiquidity, valuation, and lack of a publicmarket where they can be bought and sold. Investing in Alternative Investmentscarries the risk of loss to some or all of your principal investment. Alternative Investments that fall underRule 506 Regulation D of the Investment Company Act of 1940 (“the Act”) areconsidered unregistered funds, and therefore, are not regulated in the same wayas a registered fund under the Act. Depending on the type of investment, aprospective investor must prequalify as an Accredited Investor or QualifiedPurchaser under Rule 506 or Qualified Client defined under Rule 205-3 of theInvestment Advisers Act of 1940 before investing. Please carefully review theinvestment’s Private Placement Memorandum (PPM) and/or other Offering Documentsand Disclosures before investing in an Alternative Investment.
Looking Ahead
Bonds took center stage this quarter. Rising inflation, a Fed rate hike and a broad Treasury selloff drove yields to their highest levels in nearly two decades. As a result, the Bloomberg U.S. Aggregate Bond Index, the most widely followed gauge of the U.S. bond market, fell 3.5%.
Rising rates are typically a headwind for equities for two reasons. First, higher bond yields make fixed income a more competitive alternative, which can draw capital away from stocks. Second, higher rates reduce the present value of companies’ future cash flows, since those cash flows are discounted at a higher rate. Despite these pressures, U.S. equities continued to set new all-time highs and finished the quarter with positive returns.
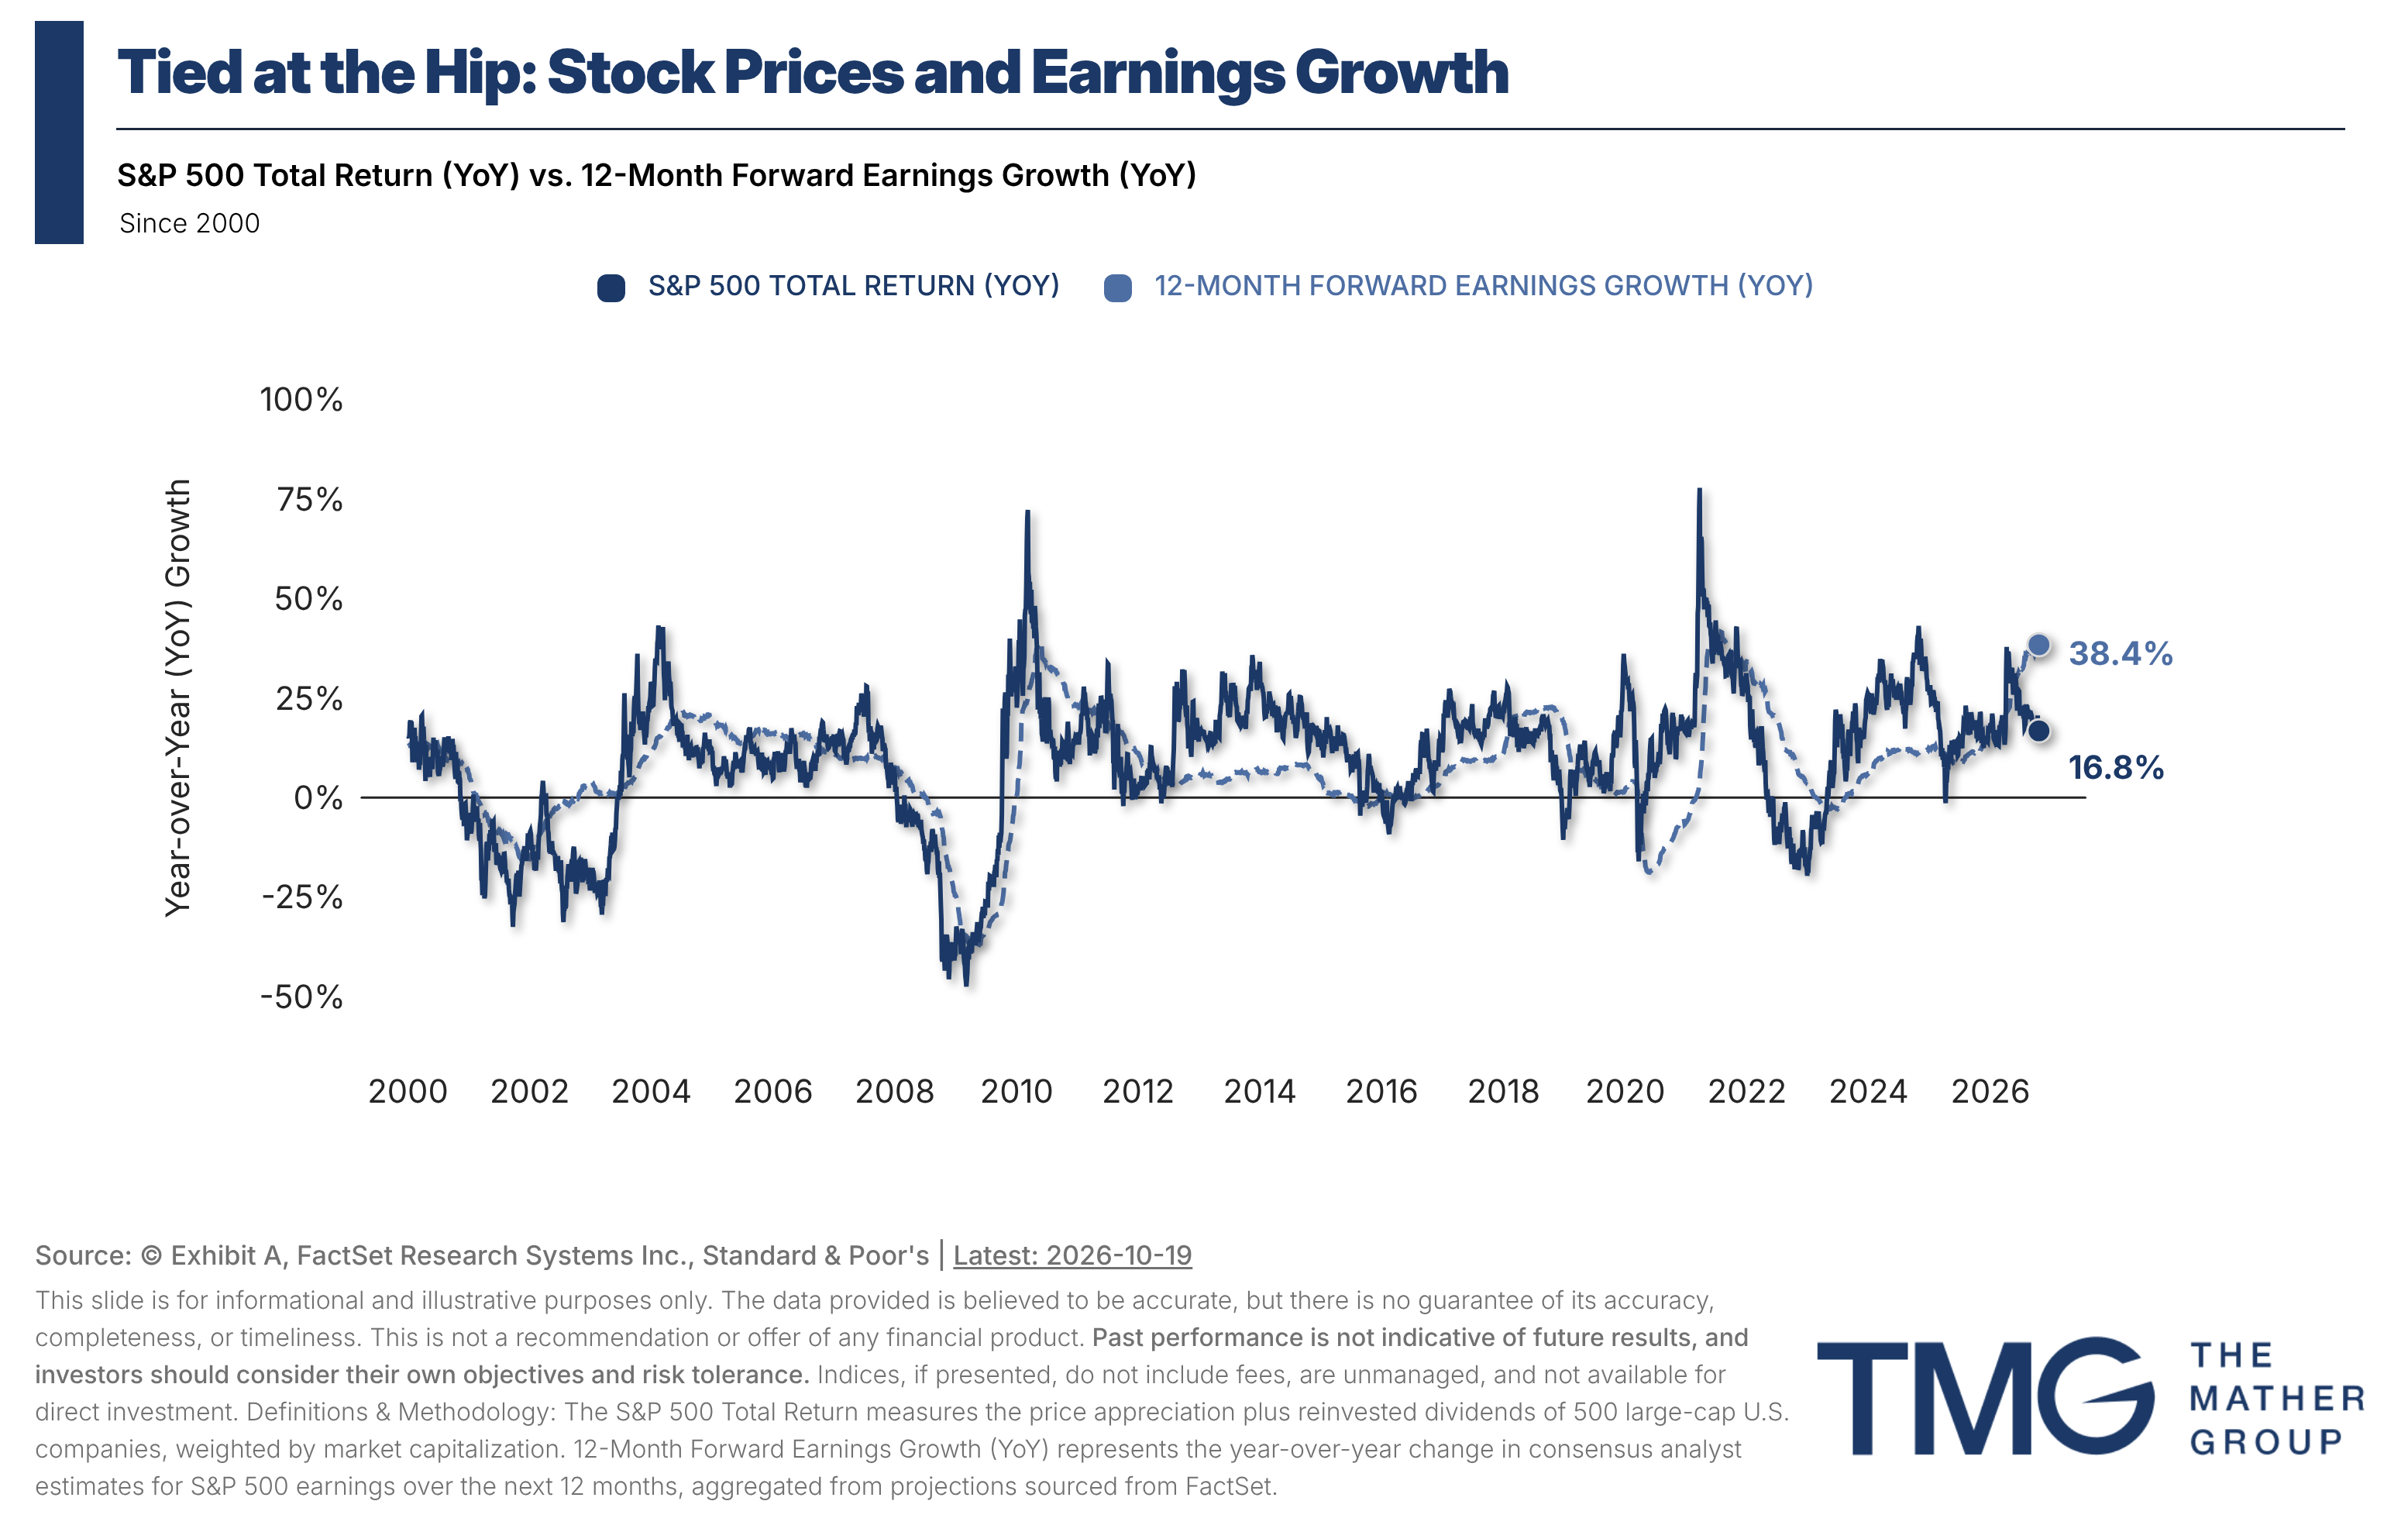
Earnings have been the market’s primary driver. S&P 500 companies are expected to grow earnings 32% in 2026, a sharp acceleration from 13% in 2025 and 10% in 2024. Because stock prices have risen more slowly than earnings, valuations have improved: the index’s forward price-to-earnings ratio ended the third quarter at roughly 19x, down from about 22x earlier in the year and closer to its 30-year average of 17.2x. In effect, the market has absorbed higher inflation and interest rates through lower valuations rather than lower prices.
Third-quarter earnings, which arrive over the coming weeks, will be an important test. Aggregate S&P 500 profits are expected to rise about 30% from a year ago, with the 10 largest companies accounting for roughly 37% of the total. So far, the economy has proven resilient enough to absorb higher inflation and interest rates.
Whether earnings can continue to carry the market remains to be seen, and some uncertainty is always part of investing. At The Mather Group, we don’t build portfolios around short-term predictions. Instead, we focus on what we can control: diversification that doesn’t depend on any single theme, AI included; high-quality bonds with a measured approach to duration; and disciplined moves such as locking in today’s higher yields and harvesting losses to help manage taxes.
Sources
i “As the 2026 Midterms Approach, Economy is Front and Center” Pew Research Center, July 23, 2026.
ii “The S&P 500 Has Never Been Lower 12 Months After a Midterm Election. Not Once in 19 Tries. Here's Whether 2026 Could Finally Break That Streak.”, The Motley Fool, Oct 5, 2026
iii YCharts https://ycharts.com/yield_curve
iv 2026 U.S. Economic Events & Analysis – Consumer Confidence, Econoday, 9/29/2026
v 2026 U.S. Economic Events & Analysis – Consumer Sentiment, Econoday, 10/9/2026
vi 2026 U.S. Economic Events & Analysis – Employment Situation, Econoday, 10/2/2026
vii 2026 U.S. Economic Events & Analysis – PMI Manufacturing Final, Econoday, 10/1/2026
viii 2026 U.S. Economic Events & Analysis – ISM Manufacturing Index, Econoday, 10/1/2026
x 2026 U.S. Economic Events & Analysis – PMI Composite Final, Econoday, 10/5/2026
xi 2026 U.S. Economic Events & Analysis – ISM Services Index, Econoday, 10/5/2026
Need more help?
Contact The Mather Group, your advisor, health insurance professional, or your state’s health insurance assistance program (SHIP) for additional information. SHIP is a national program that offers one-on-one Medicare counseling and assistance to individuals and their families.


Key Highlights to Keep You Informed
Interest rates climbed sharply this quarter, driven by higher oil prices, persistent inflation and a Federal Reserve (Fed) rate hike. Stocks still finished higher on the back of strong corporate earnings, while bonds lost value in the short term but now offer some of the most attractive yields in nearly two decades.
Rising Interest Rates
A global bond market selloff pushed interest rates higher, raising borrowing costs for businesses and consumers alike. The move began with the collapse of the Iran ceasefire, which sent oil prices up and renewed inflation concerns.
The Federal Reserve held short-term rates steady in July, but market pressure kept pushing long-term yields higher. In August, the U.S. Treasury tried to ease that pressure by buying long-term bonds in the open market; the effort proved ineffective. In September, the Fed raised its policy rate by 0.25 percentage points to help contain inflation.
Why it matters: Long-term rates set the cost of mortgages and corporate borrowing. The 30-year Treasury yield ended the quarter at 5.6%, its highest level since 2001.
The National Debt Passes $40 Trillion
The U.S. national debt surpassed $40 trillion for the first time, a notable milestone that drew significant attention in August. While the headline figure itself is less meaningful over time, given economic growth and inflation, debt sustainability is more commonly assessed relative to the size of the economy.
By that measure, Federal debt stands at roughly 123% of GDP, the highest since World War II. After the war, the ratio fell for decades to about 30% in the early 1980s before trending higher again. For comparison, Japan's debt-to-GDP ratio is estimated at more than 200%. Some market participants have attributed rising interest rates in part to increased debt issuance by the U.S. government, as well as elevated borrowing by corporations investing in AI-related infrastructure.
Inflation and the Midterm Elections
Inflation has reemerged as acentral issue heading into the midterm elections. Fueled largely by energyprices, both the Consumer Price Index and the Federal Reserve’s preferredmeasure, the Personal Consumption Expenditures (PCE) price index, rose to 3.4%,well above the Fed’s 2% target. Core inflation, which excludes food and energy,remains more contained at 2.4%, suggesting price pressures are concentratedrather than broad-based. The Fed raised rates a quarter point in September andsignaled one more increase is likely before year-end.
A recent Pew Research Center surveyfound the economy and cost of living are voters’ leading concerns. If theelection were held today, 43% of respondents would support a Democraticcandidate and 37% a Republican candidate, with a meaningful share still undecided.i
Regardless of the outcome, midtermelections have historically brought elevated market volatility leading up toElection Day, followed by strong equity performance in the year after. TheS&P 500 has delivered positive returns in the 12 months following everymidterm election since 1950, with an average gain of approximately 14% to 15%.ii For investors, that history makes a casefor staying disciplined through the headlines.
Quarterly Market Summary
Returns (USD), as of September 30, 2026
Past performance is not a guarantee of future results. Indices are not available for direct investment. Index performance does not reflect the expenses associated with the management of an actual portfolio.
Market segment (indexrepresentation) as follows: US Stock Market (Russell 3000 Index), InternationalDeveloped Stocks (MSCI World ex USA Index [net dividends]), Emerging Markets(MSCI Emerging Markets Index [net dividends]), Global Real Estate (S&PGlobal REIT Index [net dividends]), US Bond Market (Bloomberg US Aggregate BondIndex), and Global Bond Market ex US (Bloomberg Global Aggregate ex-USD BondIndex [hedged to USD]). S&P data © 2026 S&P Dow Jones Indices LLC, adivision of S&P Global. All rights reserved. Frank Russell Company is thesource and owner of the trademarks, service marks, and copy rights related tothe Russell Indexes. MSCI data © MSCI 2026, all rights reserved. Bloomberg dataprovided by Bloomberg.
Notable Events in Q3:
July
Hopes for a peace agreement with Iran and the reopening of the Strait of Hormuz faded after the Islamabad Memorandum formally collapsed on July 8. Brent crude (the global oil benchmark) rose 20.2% for the month, briefly topping $102 per barrel. The resulting inflation worries lifted the 30-year Treasury yield to 5.27% by month-end, its highest since July 2001. The Fed nonetheless left short-term rates unchanged.
August
The S&P 500 reached new all-time highs in the first half of the month before pulling back, with energy companies providing a boost as hostilities near the Strait of Hormuz resumed. The U.S. Treasury Department confirmed the national debt had more than doubled in less than a decade. Together with sticky inflation, that milestone contributed to a more hawkish Fed (one leaning toward higher rates to fight inflation).
September
On September 16, the Federal Open Market Committee, the Fed’s rate-setting body, voted unanimously to raise the federal funds rate to a range of 3.75%–4.00%. The decision reflected inflation running above the Fed’s 2% target alongside healthy economic data.
Markets had largely expected the hike, so the immediate reaction was modest: Treasury yields rose an average of 0.03 percentage points, mostly in short-term bonds, which are most sensitive to Fed moves. Chair Warsh’s speech after the announcement reassured markets that the Fed is focused on controlling inflation and remains independent.
Month-end Treasury yields rose sharply across the curve with the 10-year increasing by 50bps and the 30-year rising by 37bps to 5.6%, the highest since 2001iii. The 30-year mortgage rate, which tracks the 10-year Treasury inched up above 7% for the first time in a year.
Economic Indicators
The third quarter saw continued conflict in the Middle East and resulting pressure on global supply chains, especially energy. As a result, measures of Consumer Confidenceiv and Consumer Sentimentv continue to worsen, as higher financing costs, inflation and geopolitical tensions remain concerns. Despite these headwinds, employment datavi show continued resilience, though with some underlying softness and slowing wage growth that will give the Fed pause when considering additional rate hikes.
Manufacturing reportsvii,viii continue to show growth, driven by the ongoing AI construction boom and a willingness to hire more workers. However, prices increased due to inflationary pressures and supply-chain issues. Service industriesix,x also show continued growth but are contending with the same inflationary and tariff-related forces seen in the manufacturing sector.
Overall, despite very negative sentiment readings, consumers continue to spend at a growing rate, though luxury goods saw a pullback. Beyond consumer spending, U.S. economic data remain resilient, with both the manufacturing and service sectors growing. Given this resilience and the structural tailwinds from AI-related capital expenditures, many continue to see the risk of a U.S. recession as low.
Market Impact on Major Asset Classes
Impact on Equities:
The third quarter brought continued market appreciation, with energy and technology stocks leading U.S. large caps higher. According to Nasdaq, gains were concentrated in a small handful of companies: 83% of S&P 500 constituents fell at least 10% from their 52-week highs, and 42% fell more than 20%. While large-cap stocks did relatively well, small-cap stocks, as measured by the Russell 2000, declined in the quarter but are still outperforming larger companies for the year. As with large caps, technology and energy companies have led the way within small-cap indexes.
International stocks also continued to perform well. The MSCI Emerging Markets Index was mostly flat, though China rose nearly 4%. China’s recovery was driven by technology, though the country is still contending with weak domestic consumer demand. Latin America, India and Middle Eastern countries were disproportionately affected by the oil shock and higher U.S. rates.
Developed international markets, as measured by the MSCI EAFE Index, rose but struggled with higher energy prices. Despite inflationary pressure, both the European Central Bank and the Bank of England kept policy rates stable. Industrial output remains stagnant, but, as in the U.S., earnings have been resilient and growing.
The MSCI Japan Index was a standout, outperforming most of the world. Although the Bank of Japan raised rates, corporate fundamentals remain solid, with FactSet estimating that Japanese earnings rose nearly 30% year over year. Robotics and semiconductor companies contributed to strong performance, while reforms and labor shortages drove wages higher. While consumers have more spending power, they remain cautious due to higher energy prices.
Despite geopolitical risk, inflation and rising rates, global markets enter the fourth quarter backed by strong earnings, which have made valuations more reasonable. The AI build-out is both the market’s key opportunity and its key risk: AI spending has been a powerful driver but returns that fall short could weigh on markets. We continue to favor broad global diversification that doesn’t rely solely on AI beneficiaries.
Major World Equity Market Performance
for Q3 2026
Impact on Fixed Income:
Bond yields climbed sharply over the quarter, driven by uncertainty over Fed policy ahead of its September meeting, persistent inflation, mounting concern over the U.S. debt-to-GDP ratio, and the war in Iran. Municipal bonds bore the brunt of the selloff, declining 6.3% for the quarter, with most of the damage coming in September (–4.36%). Treasuries fell 3% over the quarter and are now down 2.8% year to date. The Fed raised short-term interest rates this quarter, but long-term bonds saw an even bigger shift. Investors sold longer-dated Treasuries, pushing their yields higher and widening the gap between 2-year and 10-year rates by about 0.10%. Corporate bond credit spreads rose to 84 basis points, their highest level since April 2026, but remained well below long-term averages.
Rising yields put pressure on existing bondholders, since bond prices move in the opposite direction of yields. For investors looking to add individual bonds, however, the selloff has created an attractive opportunity to lock in today’s higher rates. For an investor in the top federal bracket (37% plus the 3.8% net investment income tax), the tax-equivalent yield on a 5-year AAA municipal bond rose from 4.4% at the start of the quarter to 6.6% by September 30. Holding bonds to maturity also removes much of the concern over interim price swings, whether investors are building a ladder matched to known future cash needs or a 10-year ladder that spreads interest-rate risk over time.
Tax-loss harvesting in fixed income can also help offset some equity gains. Investors can sell a portion of their individual bonds or bond funds to realize losses while also taking gains in the equity portion of their portfolio. The fixed income losses can help reduce the tax bill on equity gains. In addition, proceeds from equities could be shifted to fixed income to take advantage of the higher yields described above.
TMG recommends a shorter duration (earlier maturities) to reduce interest-rate risk and maintains a preference for high-quality, investment-grade bonds to limit credit risk.
Major Fixed Income Index Returns
for Q3 2026
Impact on Alternatives:
Higher interest rates have created challenges for real estate, an asset class often viewed as a partial substitute for fixed income. As with bonds, rising interest rates generally put downward pressure on property values, as higher yields require lower asset prices to remain attractive. In addition, elevated rates increase financing costs for property owners and investors.
Despite these headwinds, real estate has historically provided a degree of protection against inflation. Following the sharp rise in interest rates beginning in 2022, new construction activity slowed significantly as higher borrowing costs made many development projects uneconomical. Over time, reduced construction can constrain the supply of apartments, retail space and industrial properties, strengthening landlords’ ability to raise rents.
Many investors initially anticipated a rapid recovery in real estate as interest rates normalized after 2022. While that outcome has not materialized, the sector’s longer-term fundamentals appear to be improving. Slower new supply growth is helping create a more favorable balance between supply and demand, supporting future rent growth and reinforcing real estate’s inflation-hedging characteristics.
Real estate debt may be particularly attractive in the current environment. As higher interest rates and lower property valuations have pressured borrowers, lenders have gained greater negotiating power and can command higher loan yields, potentially offering a more compelling risk-adjusted return profile than equity investments in the sector.
Cambridge Associates horizon index Data
as of March 31, 2026
Private-market index returns arereported with a lag; these figures predate the 2026 rise in interest ratesdiscussed above.
Alternative Investments carry ahigher degree of risk related to illiquidity, valuation, and lack of a publicmarket where they can be bought and sold. Investing in Alternative Investmentscarries the risk of loss to some or all of your principal investment. Alternative Investments that fall underRule 506 Regulation D of the Investment Company Act of 1940 (“the Act”) areconsidered unregistered funds, and therefore, are not regulated in the same wayas a registered fund under the Act. Depending on the type of investment, aprospective investor must prequalify as an Accredited Investor or QualifiedPurchaser under Rule 506 or Qualified Client defined under Rule 205-3 of theInvestment Advisers Act of 1940 before investing. Please carefully review theinvestment’s Private Placement Memorandum (PPM) and/or other Offering Documentsand Disclosures before investing in an Alternative Investment.
Looking Ahead
Bonds took center stage this quarter. Rising inflation, a Fed rate hike and a broad Treasury selloff drove yields to their highest levels in nearly two decades. As a result, the Bloomberg U.S. Aggregate Bond Index, the most widely followed gauge of the U.S. bond market, fell 3.5%.
Rising rates are typically a headwind for equities for two reasons. First, higher bond yields make fixed income a more competitive alternative, which can draw capital away from stocks. Second, higher rates reduce the present value of companies’ future cash flows, since those cash flows are discounted at a higher rate. Despite these pressures, U.S. equities continued to set new all-time highs and finished the quarter with positive returns.
Earnings have been the market’s primary driver. S&P 500 companies are expected to grow earnings 32% in 2026, a sharp acceleration from 13% in 2025 and 10% in 2024. Because stock prices have risen more slowly than earnings, valuations have improved: the index’s forward price-to-earnings ratio ended the third quarter at roughly 19x, down from about 22x earlier in the year and closer to its 30-year average of 17.2x. In effect, the market has absorbed higher inflation and interest rates through lower valuations rather than lower prices.
Third-quarter earnings, which arrive over the coming weeks, will be an important test. Aggregate S&P 500 profits are expected to rise about 30% from a year ago, with the 10 largest companies accounting for roughly 37% of the total. So far, the economy has proven resilient enough to absorb higher inflation and interest rates.
Whether earnings can continue to carry the market remains to be seen, and some uncertainty is always part of investing. At The Mather Group, we don’t build portfolios around short-term predictions. Instead, we focus on what we can control: diversification that doesn’t depend on any single theme, AI included; high-quality bonds with a measured approach to duration; and disciplined moves such as locking in today’s higher yields and harvesting losses to help manage taxes.
Sources
i “As the 2026 Midterms Approach, Economy is Front and Center” Pew Research Center, July 23, 2026.
ii “The S&P 500 Has Never Been Lower 12 Months After a Midterm Election. Not Once in 19 Tries. Here's Whether 2026 Could Finally Break That Streak.”, The Motley Fool, Oct 5, 2026
iii YCharts https://ycharts.com/yield_curve
iv 2026 U.S. Economic Events & Analysis – Consumer Confidence, Econoday, 9/29/2026
v 2026 U.S. Economic Events & Analysis – Consumer Sentiment, Econoday, 10/9/2026
vi 2026 U.S. Economic Events & Analysis – Employment Situation, Econoday, 10/2/2026
vii 2026 U.S. Economic Events & Analysis – PMI Manufacturing Final, Econoday, 10/1/2026
viii 2026 U.S. Economic Events & Analysis – ISM Manufacturing Index, Econoday, 10/1/2026
x 2026 U.S. Economic Events & Analysis – PMI Composite Final, Econoday, 10/5/2026
xi 2026 U.S. Economic Events & Analysis – ISM Services Index, Econoday, 10/5/2026
Need more help?
Contact The Mather Group, your advisor, health insurance professional, or your state’s health insurance assistance program (SHIP) for additional information. SHIP is a national program that offers one-on-one Medicare counseling and assistance to individuals and their families.