All Stock Market Rallies Are Not Created Equal:
This Week’s Market Volatility
June 12, 2020
On February 19th, 2020, the S&P 500 Index1 reached a historic high of 3,386. Only 33 days later (just 23 market trading days) on March 23rd, 2020, the S&P 500 had fallen 33.9% to a level of 2,237. The primary sources of this significant decline were threefold: the growing dimension of the COVID-19 pandemic; resultant concerns about its potential economic and financial fallout; and a somewhat tepid initial response to the pandemic by institutions such as the Fed, the U.S. Treasury and various levels of government.
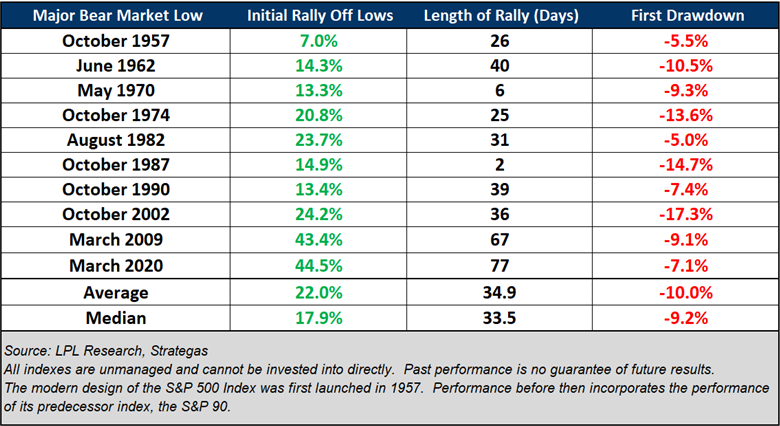
On March 24th, the S&P 500 reversed its decline, and began its ascent once again. Thus, this 33-day fall became the shortest S&P 500 bear market since the creation of the index. As shown in the table below, each of the 10 bear markets since 1957 have been followed by a market rally of varying levels and duration, averaging a 22% uptick lasting ~ 35 days. Our so-called “COVID-19 Rally” lasted 77 days until this last Wednesday, and it experienced a market rise in the S&P 500 of 44.5%. The last column, however, shows that such rallies inevitably encounter a market reversal averaging ~ 10%. However, even including Thursday’s significant market decline, our COVID-19 rally has only given back 7.1% of its recent gains. As today's market performance illustrates, even these drawdowns may reverse again in just a matter of days.
Pullbacks Are Normal After Major Lows Are In Place
S&P 500 Index Drawdowns After Rally Off Lows
The COVID-19 rally, while somewhat stunning in its dimension and duration, ended due to a myriad of factors. Let’s focus on just three: an uptick in reported COVID cases that may portend a so-called second wave of the infection; stronger warnings about potential financial and economic stress from Chairman Powell of the Fed; and a significant fall in the price of crude oil.
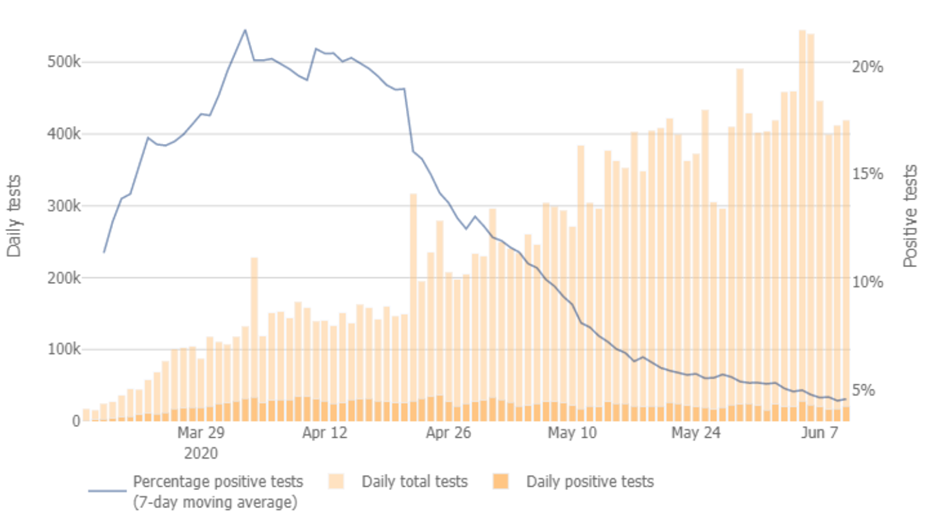
Let’s examine these factors in turn, starting with the concern this week about COVID cases. As shown in the graphic below, the number of U.S. COVID tests has risen to almost 500,000 per day, while the percentage of positive tests has dropped significantly from over 20% in April to less than 5% today. Efforts by governments and individuals to lessen contact through various restrictions appear to have strongly contributed to this downturn.
U.S. Plot of New Cases
However, the market’s concern this week was not focused on COVID at the national level, but just on 4 states, i.e. Arizona, California, Florida and Texas, which had lifted many of their social restrictions in advance of other states. As these 4 states comprise ~ 30% of the U.S. population, any significant rise in positive cases—a so-called second wave—could have adverse implications for the projected economic recovery which underpinned the COVID rally.
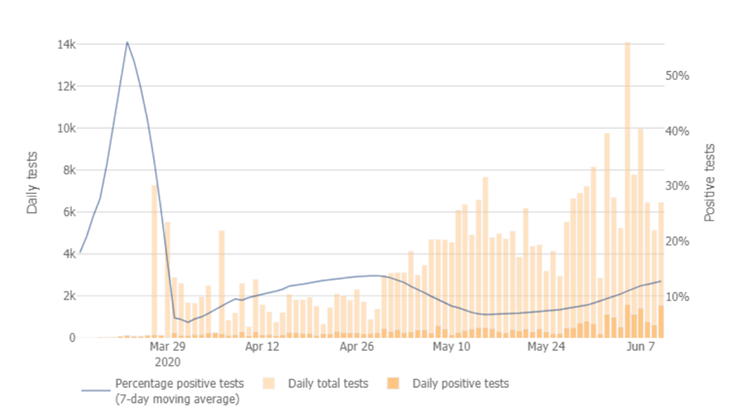
More specifically, as shown in the graphic below, Arizona significantly increased its testing rate, but the rising number of positive tests has now reversed its former decline. Its current rate of 12.9% is about 3 times the overall U.S. rate of positive tests. While this uptick might result from increased testing alone, this factor does not appear to fully explain the highest rate of COVID hospitalizations occurring this week in Arizona (1,009) which now has just 28% of its statewide ICU beds unoccupied. Hopefully, increased awareness of this concerning trend—and a prompt response by both individuals and government—will contribute to cases declining once again in these 4 states. The market could respond strongly to such a decline, of course, as it could diminish fears of an imminent second wave.
AZ Response
Few market observers could fault the Fed for its somewhat belated—but outsized—response to the pandemic. It has cut the Fed Funds rate from 1.5% on March 3rd to 0.0% today, and it has promised to keep rates this low until at least 2022. It is planning to lend $2.3 trillion to households, employers, financial markets and state and local governments. The Fed is continuing to purchase $120 billion of Treasury bonds and mortgage-backed securities monthly on an open-ended basis, and, as one result, its balance sheet has grown from $4.2 trillion in March to $7.2 trillion today. Two outcomes have been that the 10-year Treasury bond has fallen from 1.88% to 0.66% since January, and 30-year mortgage rates have dropped from 3.72% to 3.17% during the same period. Whether buying or refinancing a home, borrowers are benefiting from these Fed actions.
Despite these financial stimulants, Chairman Powell was downbeat—perhaps unnecessarily so—in his public remarks this Wednesday, and the market reacted negatively. First, he warned that 2020 Gross Domestic Product (GDP)2 could fall to a negative 6.5% growth rate, after achieving a robust 4.1% rate in 2019. He did project that GDP could return to a 5.0% growth rate in 2021, however. And, despite the recent fall in the unemployment rate to 13.3%, resulting from a decline of 2.1 million unemployed workers in May, he forecast that the unemployment rate would be 9.3% at the end of 2020. It is important to note that these projections are, obviously, fraught with many uncertainties, as acknowledged even by Chairman Powell. Hence, markets may remain volatile as new information appears during the remainder of 2020.
Thursday’s 8% decline in the price of crude oil to $36.38 was another contributing factor in this week’s market downturn, and it was a result of both COVID second wave fears and the Fed’s downbeat 2020 economic assessment. Despite doubling in price since April due to a negotiated reduction in production by the major oil producers, the price began eroding this week from record high volumes already in storage (11% higher than one year ago), rising production again in the U.S. shale oil sector and increased concerns that major oil consuming industries, e.g. transportation, could take longer to achieve a major recovery. Seeing this week’s dramatic fall in price led some investors to reassess the level of uncertainty they were willing to tolerate, further contributing to the market selloff.
While uncertainty may underlie many market movements, such as those occurring this week, it should not become an obstruction to the achievement of your financial and personal goals. Rallies, as shown above, have lasted from 2 to 77 days after a bear market, but your personal financial plan has been developed with a timeframe of years, not just days or weeks. Maintaining and updating your plan provides you and The Mather Group with the structure and insight necessary to support you in the pursuit of your goals. We hope that you will reach out to one of our professional team members if you have further questions or issues to discuss.
The Mather Group (TMG) is registered under the Investment Advisers Act of 1940 as a Registered Investment Adviser with the Securities and Exchange Commission (SEC). Registration as an investment adviser does not imply a certain level of skill or training. The opinions expressed, and material provided are for general information, and should not be considered a solicitation for the purchase or sale of any security. The opinions and advice expressed in this communication are based on TMG’s research and professional experience and are expressed as of the publishing date of this communication. TMG makes no warranty or representation, express or implied, nor does The Mather Group accept any liability, with respect to the information and data set forth herein. TMG specifically disclaims any duty to update any of the information and data contained in this communication. The information and data in this communication does not constitute legal, tax, accounting, investment, or other professional advice nor is it intended to provide comprehensive tax advice or financial planning with respect to every aspect of a client's financial situation.
1 Indices:
S&P 500 Index consists of 500 stocks chosen for market size, liquidity and industry group representation, among other factors by the S&P Index Committee, which is a team of analysts and economists at Standard and Poor's. The S&P 500 is a market-value weighted index, which means each stock’s weight in the index is proportionate to its market value and is designed to be a leading indicator of U.S. equities, and meant to reflect the risk/return characteristics of the large cap universe. See www.standardandpoors.com for more information.
2 Gross Domestic Product (GDP):
A comprehensive measure of U.S. economic activity. GDP is the value of the goods and services produced in the United States. The growth rate of GDP is the most popular indicator of the nation's overall economic health. See www.bea.gov for more information.
Sources: Bloomberg; Bureau of Labor Statistics; Census Bureau; COVIDexitstrategy.org; Federal Reserve Board; Goldman Sachs; Johns Hopkins Coronavirus Resource Center; Reuters; St. Louis Federal Reserve Bank; Wall Street Journal.


