Fourth Quarter 2021 Market Returns:
S&P 500 Sectors & Asset Classes
The below charts visually demonstrate that the drivers of return are constantly changing each year, which emphasizes the importance of a well-diversified portfolio. In this article, we provide a snapshot of recent S&P 500 sector and asset class performance.
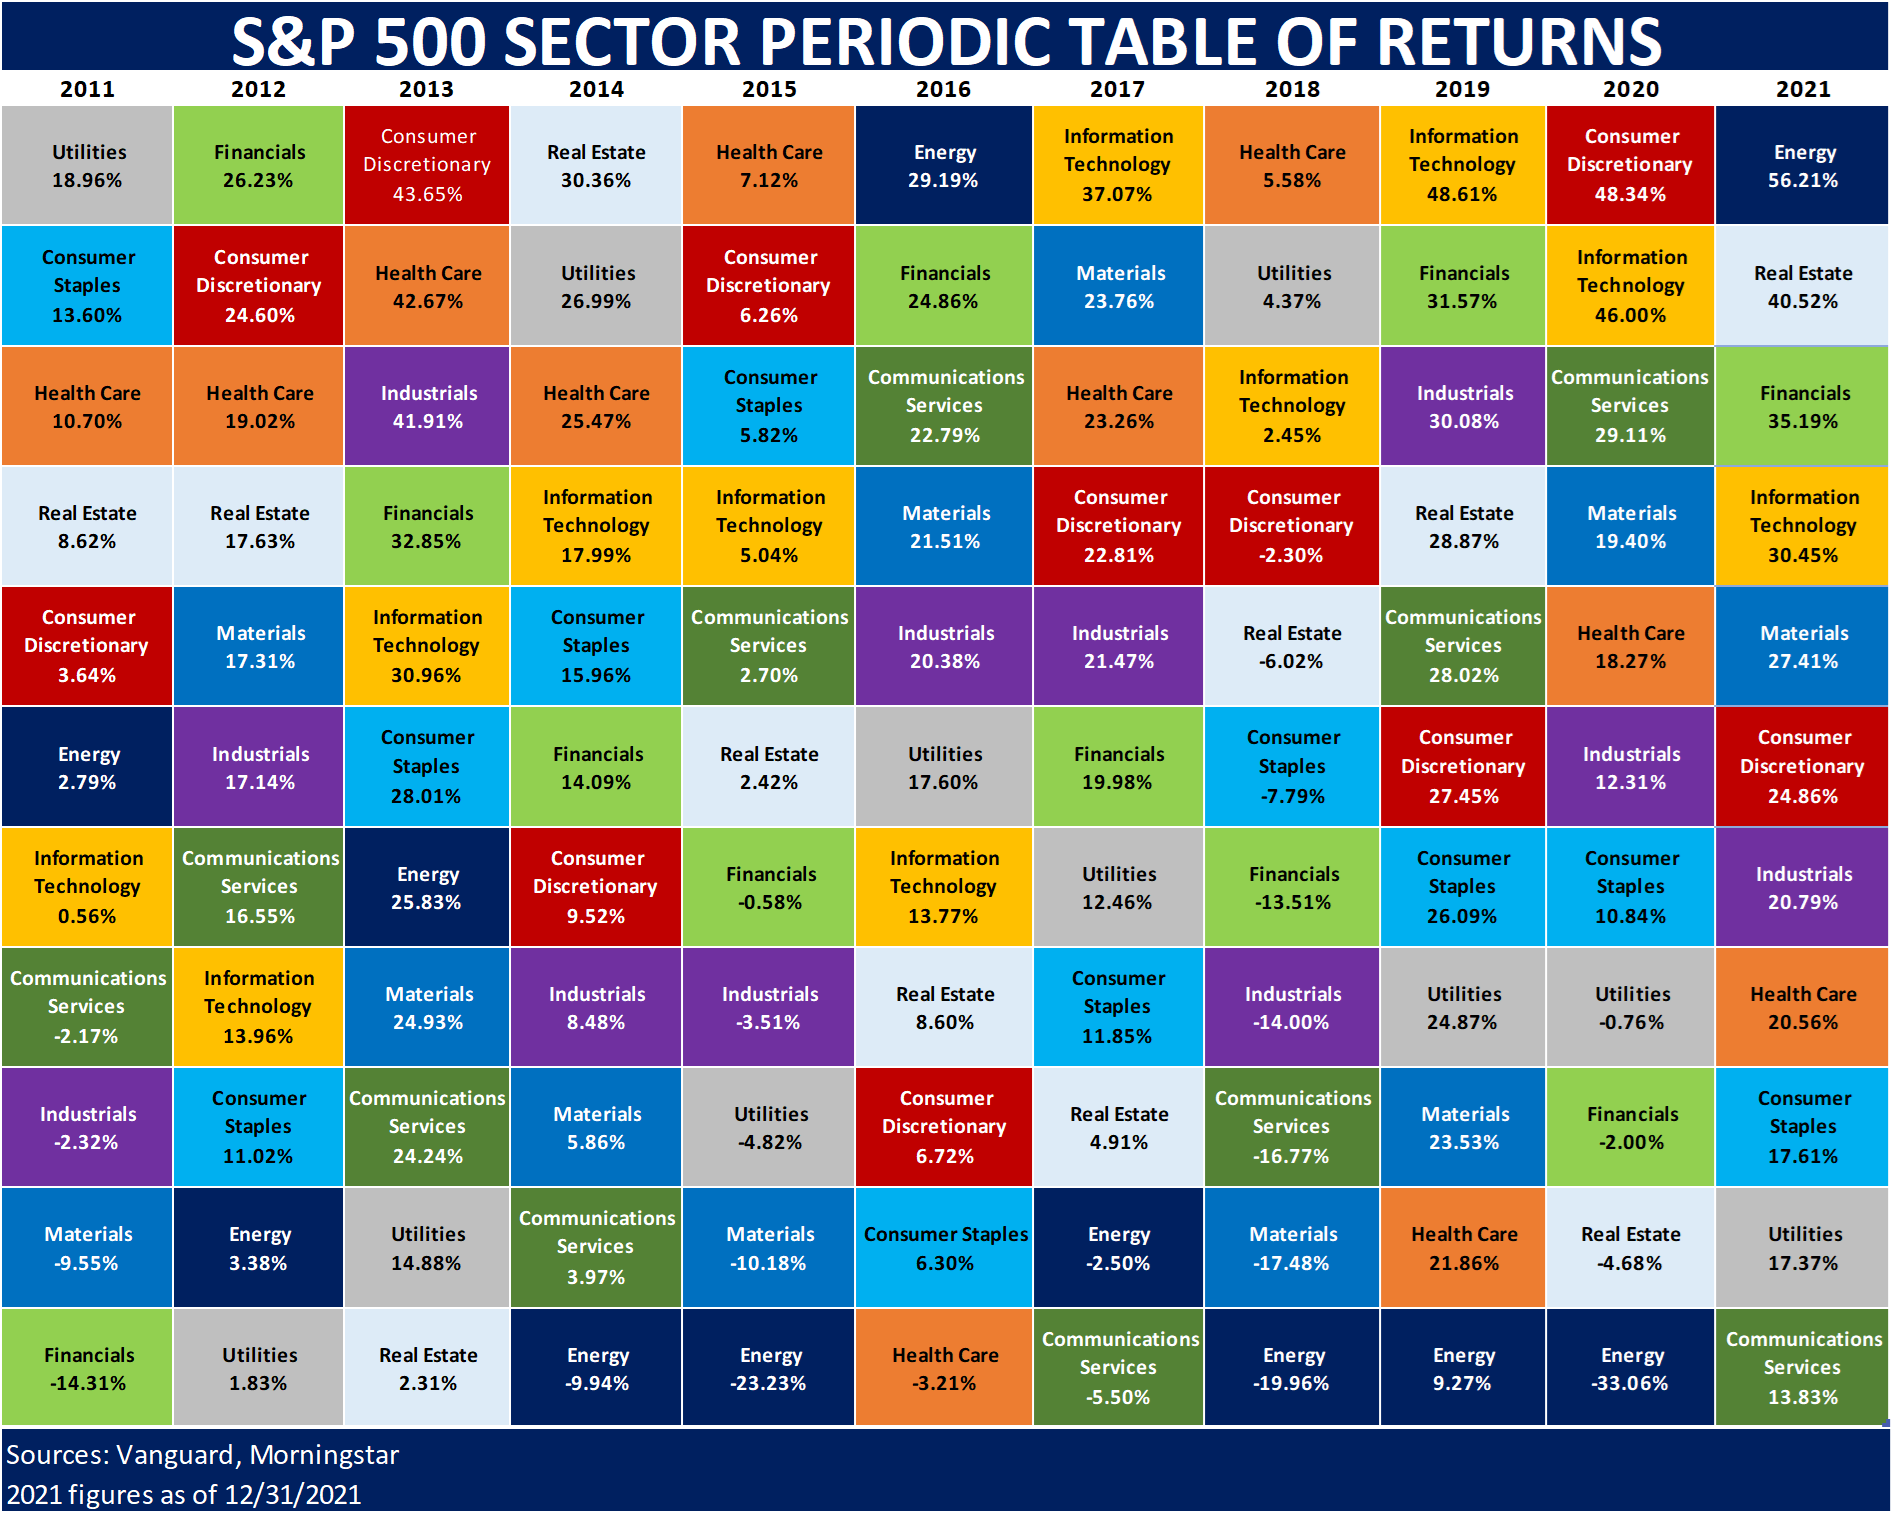
S&P 500 SECTOR PERIODIC TABLE OF RETURNS (2011 - 2021)
This chart contains the 11 sectors that constitute the S&P 500 Index. Each sector is given a unique color, and each column is organized from highest return (top) to lowest return (bottom), for a given year. The 11 columns display annual performance for each sector from 2011 to 2021.
2021 Leaders:
- Energy = 56.21%
- Real Estate = 40.52%
- Financials = 35.19%
2021 Laggards:
- Communication Services = 13.83%
- Utilities = 17.37%
- Consumer Staples = 17.61%
ASSET CLASS PERIODIC TABLE OF RETURNS (2011 - 2021)
This chart is composed of 11 standard asset classes and an example of a diversified 60% stock and 40% bond portfolio. Each asset class is given a unique color, and each column is organized from highest return (top) to lowest return (bottom), for a given year. The 60/40 portfolio (in bright yellow) generally falls somewhere in the middle, helping to illustrate how a diversified portfolio can reduce volatility. The 11 columns display annual performance for each asset class from 2011 to 2021.
2021 Leaders:
- Real Estate (REIT) = 40.52%
- Commodities = 31.05%
- US Large-Cap Stock = 28.75%
2021 Laggards:
- Gold = -4.15%
- US Interm. Treasuries = -3.33%
- International Bonds = -1.91%

Please feel free to reach out to us with any questions.
Definitions
- Interm. = Intermediate Term
- 60/40 Portfolio: An industry standard, moderate risk portfolio is composed of 60% equity and 40% fixed income. Sample portfolio shown reflects 60% Vanguard World Stock Market ETF (VT) and 40% Vanguard Total Bond Market ETF (BND) and does not represent an actual TMG Model Portfolio.
- S&P (Standard & Poor’s) 500: A stock market index that measures the stock performance of 500 large companies listed on stock exchanges in the United States.
- Vanguard World Stock Market ETF (VT) seeks to track the investment performance of the FTSE Global All Cap Index, a free-float-adjusted, market-capitalization-weighted index designed to measure the market performance of large-, mid-, and small-capitalization stocks of companies located around the world. The index includes approximately 7,400 stocks of companies located in 47 countries, including both developed and emerging markets.
- Vanguard Total Bond Market ETF (BND) seeks to track the investment performance of the Bloomberg U.S. Aggregate Float Adjusted Index, an unmanaged benchmark representing the broad, investment-grade U.S. bond market. The fund invests in taxable investment-grade corporate, U.S. Treasury, mortgage-backed, and asset-backed securities with short, intermediate, and long maturities in excess of one year, resulting in a portfolio of intermediate duration.
Sources
Vanguard, Morningstar, BlackRock, Barclays, State Street, PIMCO
Important Disclosure Information
The Mather Group, LLC (TMG) is registered under the Investment Advisers Act of 1940 as a Registered Investment Adviser with the Securities and Exchange Commission (SEC). Registration as an investment adviser does not imply a certain level of skill or training. For a detailed discussion of TMG and its investment advisory services and fees, please see the firm’s Form ADV on file at www.adviserinfo.sec.gov. The opinions expressed, and material provided are for general information and should not be considered a solicitation for the purchase or sale of any security. The opinions and advice expressed in this communication are based on TMG’s research and professional experience and are expressed as of the publishing date of this communication. All return figures shown are for illustrative purposes only. TMG makes no warranty or representation, express or implied, nor does TMG accept any liability, with respect to the information and data set forth herein. TMG specifically disclaims any duty to update any of the information and data contained in this communication. The information and data in this communication does not constitute legal, tax, accounting, investment, or other professional advice. Investing in securities involves risks, and there is always the potential of losing money when you invest in securities. Before investing, consider your investment objectives. Past performance does not guarantee future results.
An index is a portfolio of specific securities, the performance of which is often used as a benchmark in judging the relative performance of certain asset classes. Indexes are unmanaged portfolios and investors cannot invest directly in an index. An index does not charge management fees or brokerage expenses, and no such fees or expenses were deducted from the performance shown.


