First Quarter 2026 Market Returns: S&P 500 Sectors & Asset Classes
April 14, 2026
In today's dynamic market, the factors driving returns are ever-changing. Our latest analysis underscores the value of a well-diversified portfolio by highlighting recent performance trends across S&P 500 sectors and asset classes. Explore the charts below to gain deeper insights into these trends and optimize your investment strategy with our expert guidance.
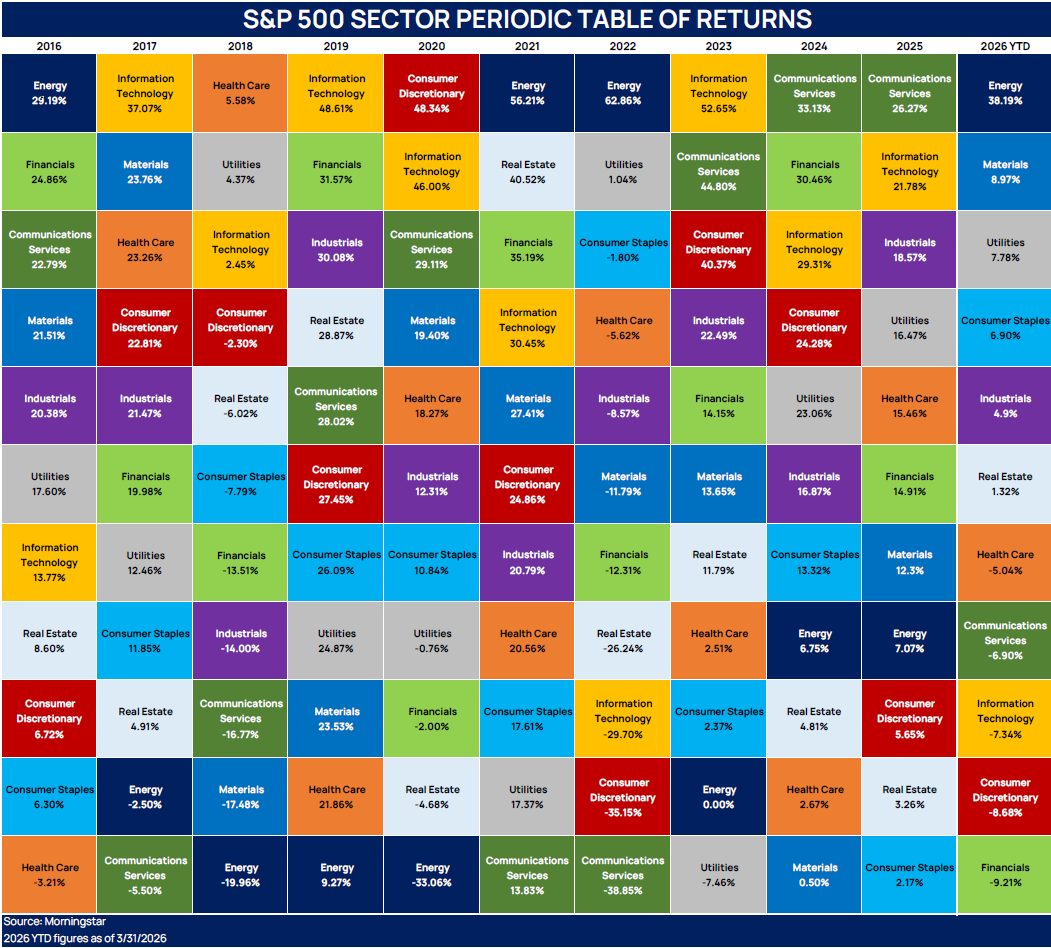
S&P 500 SECTOR PERIODIC TABLE OF RETURNS
(2016 - 2026)
This chart contains the 11 sectors that constitute the S&P 500 Index. Each sector is given a unique color, and each column is organized from highest return (top) to lowest return (bottom), for a given year. The first 10 columns display annual performance for each sector from 2016 to 2025. The last column on the right illustrates year-to-date (YTD) performance, as of 3/31, for 2026.
2026 YTD Leaders:
- Energy = 38.19%
- Materials = 8.97%
- Utilities = 7.78%
2026 YTD Laggards:
- Information Technology = -7.34%
- Consumer Discretionary= -8.68%
- Financials = -9.21%
Click this chart to view it in full screen.
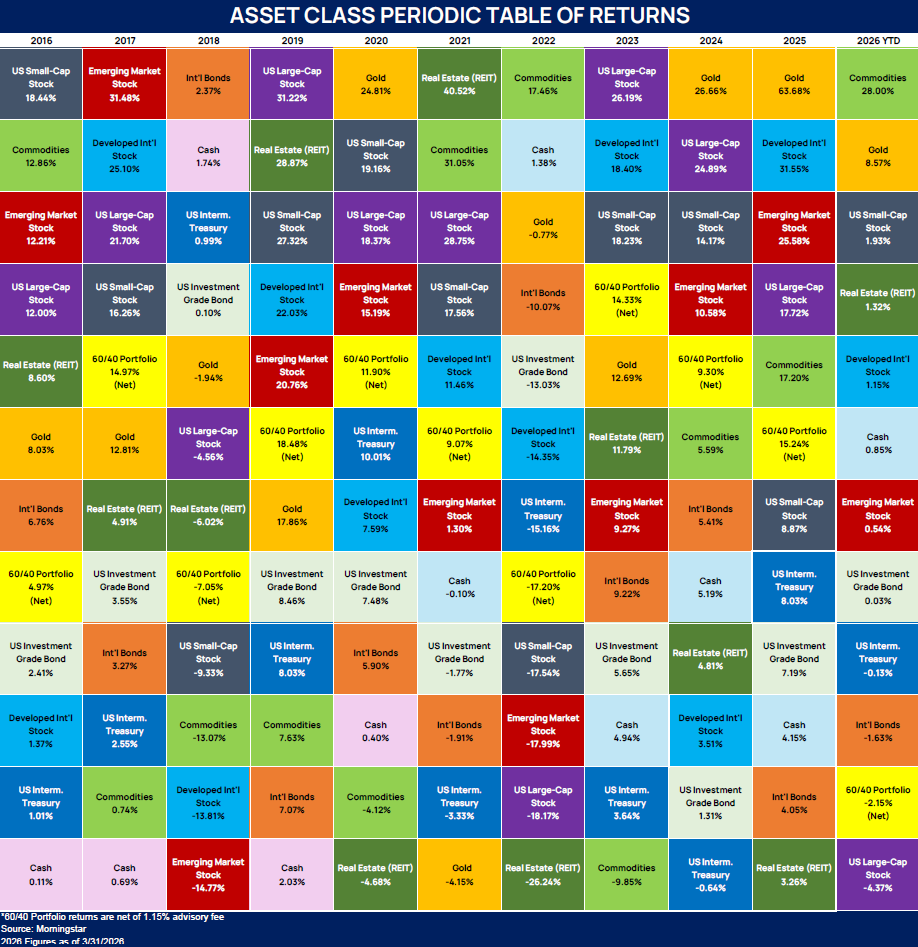
ASSET CLASS PERIODIC TABLE OF RETURNS
(2016 – 2026)
This chart is composed of 11 standard asset classes and an example of a diversified 60% stock and 40% bond portfolio. Each asset class is given a unique color, and each column is organized from highest return (top) to lowest return (bottom), for a given year. The 60/40 portfolio (in bright yellow) generally falls somewhere in the middle, helping to illustrate how a diversified portfolio can reduce volatility. The first 10 columns display annual performance for each asset class from 2016 to 2025. The last column on the right illustrates year-to-date (YTD) performance, as of 3/31, for 2026.
2026 Leaders:
- Commodities = 28%
- Gold = 8.57%
- U.S. Small Cap Stocks = 1.93%
2026 Laggards:
- International Bonds = -1.63%
- 60/40 Stock to Bond Portfolio = -2.15%
- U.S. Large Cap Stocks = -4.37%
Click this chart to view it in full screen.
Please feel free to reach out to us with any questions.
Need more help?
Contact The Mather Group, your advisor, health insurance professional, or your state’s health insurance assistance program (SHIP) for additional information. SHIP is a national program that offers one-on-one Medicare counseling and assistance to individuals and their families.


In today's dynamic market, the factors driving returns are ever-changing. Our latest analysis underscores the value of a well-diversified portfolio by highlighting recent performance trends across S&P 500 sectors and asset classes. Explore the charts below to gain deeper insights into these trends and optimize your investment strategy with our expert guidance.
S&P 500 SECTOR PERIODIC TABLE OF RETURNS
(2016 - 2026)
This chart contains the 11 sectors that constitute the S&P 500 Index. Each sector is given a unique color, and each column is organized from highest return (top) to lowest return (bottom), for a given year. The first 10 columns display annual performance for each sector from 2016 to 2025. The last column on the right illustrates year-to-date (YTD) performance, as of 3/31, for 2026.
2026 YTD Leaders:
- Energy = 38.19%
- Materials = 8.97%
- Utilities = 7.78%
2026 YTD Laggards:
- Information Technology = -7.34%
- Consumer Discretionary= -8.68%
- Financials = -9.21%
Click this chart to view it in full screen.
ASSET CLASS PERIODIC TABLE OF RETURNS
(2016 – 2026)
This chart is composed of 11 standard asset classes and an example of a diversified 60% stock and 40% bond portfolio. Each asset class is given a unique color, and each column is organized from highest return (top) to lowest return (bottom), for a given year. The 60/40 portfolio (in bright yellow) generally falls somewhere in the middle, helping to illustrate how a diversified portfolio can reduce volatility. The first 10 columns display annual performance for each asset class from 2016 to 2025. The last column on the right illustrates year-to-date (YTD) performance, as of 3/31, for 2026.
2026 Leaders:
- Commodities = 28%
- Gold = 8.57%
- U.S. Small Cap Stocks = 1.93%
2026 Laggards:
- International Bonds = -1.63%
- 60/40 Stock to Bond Portfolio = -2.15%
- U.S. Large Cap Stocks = -4.37%
Click this chart to view it in full screen.
Please feel free to reach out to us with any questions.
Need more help?
Contact The Mather Group, your advisor, health insurance professional, or your state’s health insurance assistance program (SHIP) for additional information. SHIP is a national program that offers one-on-one Medicare counseling and assistance to individuals and their families.
.avif)