Market Update | First Quarter 2026
April 22, 2026
Key Highlights to Keep You Informed
Geopolitical Tensions and Energy Market Disruption
Geopolitical events were a prominent theme this quarter. In early January, the U.S. conducted military operations in Venezuela, followed by air strikes on Iran in late February. This escalation contributed to a sharp rise in energy prices, as tensions in the region disrupted shipping through the Strait of Hormuz, constraining oil flows from the Middle East and pushing prices above $100 per barrel.
Technology Sector Pressure from Artificial Intelligence
Concerns around artificial intelligence disruption weighed heavily on the technology sector during the quarter. Fears that automation could quickly erode traditional software business models and pricing power led to a broad selloff, particularly across software companies. Software stocks declined nearly 24% for the quarter, with weakness spreading across the broader technology sector, as measured by the S&P Software & Services Index.
Trade Policy Volatility and Legal Shifts
Trade policy developments added another layer of uncertainty during the quarter. The Supreme Court struck down tariffs announced last year, ruling that the International Economic Emergency Powers Act does not grant the president authority to impose taxes without congressional approval. Within hours of the decision, new 10% global tariffs were introduced under the Trade Act of 1974. Importers have begun registering for refunds of the overturned tariffs, accounting for roughly $120 billion of the total i.
Renewed Stagflation Concerns
Slowing GDP growth and rising inflation renewed concerns about stagflation, a term used to describe periods of weak economic growth paired with persistent inflation. Normally, slower growth is accompanied by easing inflation, which gives the Federal Reserve more flexibility to lower interest rates in support of the economy. With inflation still above target, that flexibility remains limited. Prior to the war with Iran, inflation remained above the Fed’s 2% target, though most readings pointed to a gradual deceleration. In March, the Consumer Price Index rose to 3.3%, driven largely by higher energy prices. Core inflation, which excludes food and energy, increased 2.6% and came in below expectations.
Labor Market Moderation and Structural Shifts
The labor market showed signs of softening after a strong start to the quarter. Following a solid January report, payrolls declined by 92,000 in February before rebounding with a stronger-than-expected gain of 178,000 jobs in March. The technology sector was notably impacted, with 45,363 layoffs announced during the quarter, with 20.4% explicitly tied to AI and automation ii. Some of the largest layoffs have come from Oracle, Amazon and Meta (Facebook). Weaknesses in job creation may not be an indicator of weakening economic conditions as growth in the labor force has also stalled, leading the Fed to look elsewhere for labor market readings iii.
Quarterly Market Summary
Returns (USD), as of March 31, 2026

Past performance is not a guarantee of future results. Indices are not available for direct investment. Index performance does not reflect the expenses associated with the management of an actual portfolio.
Market segment (index representation) as follows: US Stock Market (Russell 3000 Index), International Developed Stocks (MSCI World ex USA Index [net dividends]), Emerging Markets (MSCI Emerging Markets Index [net dividends]), Global Real Estate (S&P Global REIT Index [net dividends]), US Bond Market (Bloomberg US Aggregate Bond Index), and Global Bond Market ex US (Bloomberg Global Aggregate ex-USD Bond Index [hedged to USD]). S&P data © 2026 S&P Dow Jones Indices LLC, a division of S&P Global. All rights reserved. Frank Russell Company is the source and owner of the trademarks, service marks, and copyrights related to the Russell Indexes. MSCI data © MSCI 2026, all rights reserved. Bloomberg data provided by Bloomberg.
Notable Events in Q1:
January
An unexpected geopolitical development marked the start of 2026, as U.S. forces captured Venezuelan President Nicolás Maduro in a targeted operation. The event briefly lifted oil prices, though markets stabilized quickly as the disruption was viewed as limited. Venezuela holds the world’s largest crude reserves but represented just 0.8% of global supply in 2024, and any meaningful production increase will take time and investment. Trade policy remained fluid, with tariffs both introduced and withdrawn, including the removal of tariffs on eight European countries following NATO discussions around Greenland security. Inflation trends were largely in line with expectations, with November’s core Personal Consumption Expenditures rising 2.8% year over year, driven by recreational goods, vehicles, and healthcare services. Monetary policy also drew attention. The president nominated Kevin Warsh, known for a more hawkish stance on interest rates, to succeed Federal Reserve Chair Jerome Powell. Uncertainty remains around whether Powell will step down before his term concludes in 2028.
February
The month started on a positive note with encouraging economic data releases. The January jobs report released during the first week of February showed the economy created 130,000 new jobs, well ahead of expectations. Manufacturing activity was also stronger than expected, showing expansion for the first time in 10 months. Inflation also looked under control with a steady month-over-month increase of 0.3% in the Consumer Price Index (CPI). Despite mostly positive data, stocks were weak with the S&P 500 falling 60 points for the month.
March
As geopolitical tensions and market volatility ramped up following U.S-Israel strikes on Iran, the VIX climbed over 30% in early March, and oil prices rose by over 50% during the same period. Given these increases, energy and utility stocks performed well while technology stocks struggled. With inflation fears rising, the expectation of higher prices has led the Federal Reserve to pause rate cuts despite risk to the economy.
Economic Indicators
The first quarter delivered a mixed, but resilient economic backdrop, as geopolitical conflict in both Venezuela and Iran dampened sentiment, but economic data remained better than feared. Measures of Consumer Confidence iv and Consumer Sentiment v remain poor due to the ongoing war and higher gas prices. Despite increases to oil prices, the U.S. remains better positioned to weather the storm compared to prior oil shocks, as the U.S. is now a net exporter of oil, but still not completely immune given the global nature of the oil market and refining capabilities. Household balance sheets remain relatively healthy as well, indicating that consumers should be able to withstand adversity for a time.
Reversing course from previous quarters, manufacturing reports vi, vii have shown signs of improvement, as the sector has begun to grow despite ongoing geopolitical risks and tariff-related headwinds.
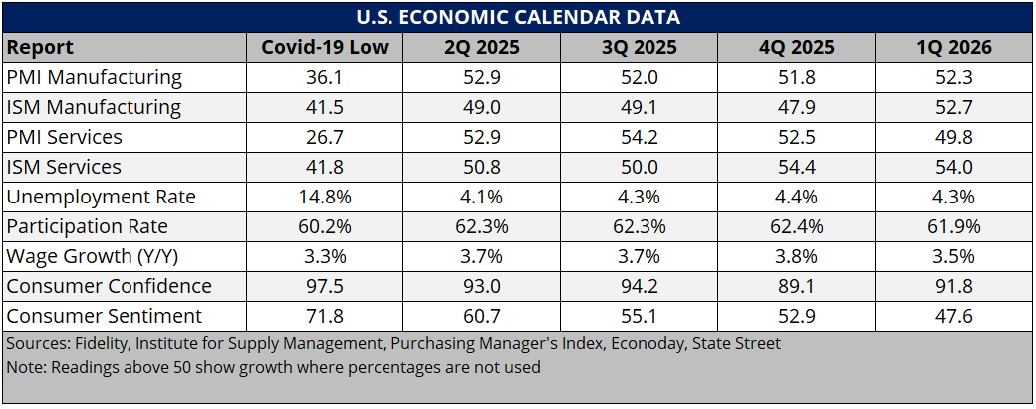
Conversely, service industries viii, ix have weakened as tariffs and pricing pressures have taken a toll, along with weakening employment. Employment data x has been better than feared, but the low unemployment rate is partially due to more people falling out of the labor force, and previous reports have been revised lower, increasing concern about the true strength of the labor market. Despite elevated concerns at a macro and headline level, we remain encouraged that the fundamentals that drive market returns remain promising. To illustrate, while valuations have gotten more expensive over time and should be acknowledged, realized earnings and earnings expectations have remained healthy. In fact, for the calendar year 2026, U.S. earnings are still expected to grow 17%, following the 14% growth seen in 2025. Even more encouraging, we expect to see growth from companies outside the Magnificent 7 and beyond AI-centric businesses, along with improved earnings overseas.
Market Impact on Major Asset Classes
Impact on Equities:
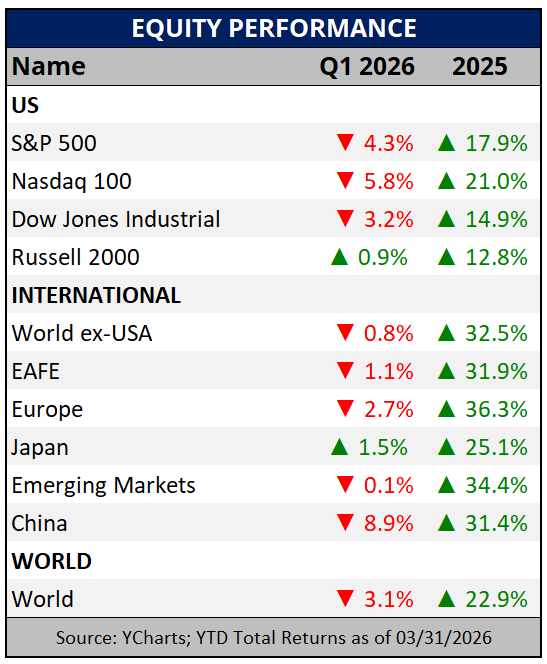
The first quarter saw a weak start in 2026, but not nearly as negative as market headlines indicated, with the S&P 500 and large-cap stocks only down 4.3% due to growth stocks struggling. These struggles highlighted a broader market rotation as value stocks performed better and small-cap stocks advanced. These market struggles, however uncomfortable, must be viewed within the context they deserve. Volatility is ever present, market corrections are frequent, and we are still well in positive territory over the past 12 months given the strong performance markets delivered in 2025.
Outside of the U.S., international stocks performed relatively well compared to U.S. markets and were down slightly. Developed international markets, measured by MSCI EAFE, fell 1.1% as much of the world struggled with higher inflation and oil prices. The MSCI Japan Index performed well and rose 1.5%, as their economy continues to improve given debt to GDP is lower, with higher underlying growth, increased tax receipts and healthier inflation. These dynamics make it more attractive for foreign and domestic investors to deploy capital into their market, which we believe is still attractively priced.
MSCI Emerging Markets was essentially flat despite a strengthening dollar, and an 8.9% quarterly decline in China where there have been some deflationary pressures. Taiwan and South Korea were both bright spots as they benefited from AI-related semiconductor demand.
A key theme continues to be geopolitical volatility throughout the world. While often terrible from a human perspective, it is important to remember that these issues are not the main driver of risk in the market. After all, long-term data shows that markets have frequently dealt with war and geopolitical issues. While the initial shock of an event may lead to periodic downturns, we often see strong stock market returns shortly thereafter. We maintain that a bigger risk to portfolios is a lack of diversification, improper risk levels, and ignoring fundamental issues like expensive valuations that historically lead to lower future returns.
Looking ahead, there are reasons to exercise caution, but earnings expectations remain positive, and we expect diversified investors to benefit given relatively attractive valuations outside of mega-cap U.S. stocks and attractive valuations outside of the U.S. The outperformance seen for international stocks in 2025 clearly illustrated the benefit of diversification, which has continued this year, just as it had in previous decades following strong performance in the U.S. Further, if AI becomes as transformative as many expect, we believe history may repeat as we saw with cycles involving technologies like railroads and the internet. As new technology develops, there is often a lag between the financial impact of the technology on its producers and end clients. Over time, we expect the benefits of AI on stock prices will flow beyond the major technology companies and benefit other areas of the market.
Major World Equity Market Performance
for Q1 2026
Impact on Fixed Income:
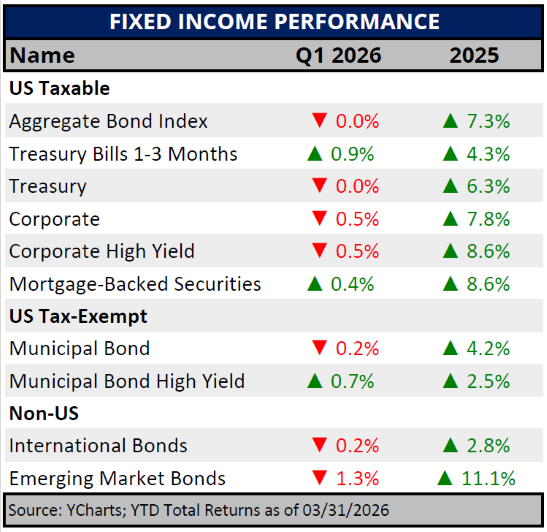
The U.S. Aggregate Bond, Treasury and municipal indices were essentially flat for the quarter. Treasury bills posted gains as investors sought out some protection from equity volatility. Municipals started the year off strong (up 0.94% in January) thanks in part to the January effect, wherein municipal issuance at the beginning of the year is low in relation to the amount of bonds maturing leading to an imbalance in the cash available to reinvest and the amount of new bonds available in the market. The outlook for the remainder of the year is more municipal issuance, in line with the previous few record setting years.
Treasury yields whipsawed throughout the quarter on international news with the 30yr dipping from 4.91% in January to 4.64% by the end of February, only to rise back to 4.98% towards the end of March on inflation fears.
Corporate investment grade and high yield spreads remain below their historical averages. While credit markets continue to show stability, current valuations suggest investors are not being fully compensated for the level of risk being taken.
Treasury Curve vs. Municipal Curve

Elevated yields in Treasuries and municipals present attractive entry points for those looking to balance some of the uncertainty in equities. A bond ladder allows a buy and hold investor to lock in yields. It is important to consider the tax bracket when deciding between municipals and Treasuries. As the tax bracket increases municipals generally provide a better tax adjusted yield than Treasuries.
Major Fixed Income Index Returns
for Q1 2026
Impact on Alternatives:
When investing in private markets, fund structure should be an important consideration. This issue has been brought to light by the recent challenges in private credit. Historically private assets had been available only for institutional investors such as endowments or pension funds and extremely wealthy families. Allocations were made through closed-end funds where the investor committed to provide a predetermined amount of capital over a period of years. When the fund manager or General Partner (GP) identified an investment opportunity, they “called” the capital from the investors or Limited Partners (LP). After the investment ran its course and the GP “exited” or sold the investment, capital is returned to the LP. There is no opportunity for LPs to liquidate the investment before capital is returned and typical fund lives can range from 10 to 15 years. While this is an ideal structure to match the liquidity of the fund to the liquidity of the underlying investment for investors with infinite time horizons, it is not a great structure for individual investors that can have unexpected expenses and may not be able to lock up assets for as long.
The investment industry has tried to solve this liquidity mismatch problem for individuals by offering funds with quarterly liquidity. While this solved one problem, it created another. These funds, sometimes called “semi-liquid” still need to match the liquidity of the fund structure with the liquidity of the investments held in the fund. To achieve this, these semi-liquid funds have redemption limits that are typically set at 5% of fund assets per quarter. This feature allows individuals down to $1 million in investable assets to access investments that were only available to large institutions. However, they should not be considered fully liquid investments and liquidity constraints need to be considered when making allocations to private assets even through semi-liquid funds.
Concerns have been raised in the direct lending segment of private credit markets as the asset class has undergone some stress in recent months. Although losses have not been realized, the anticipation of losses due to a downturn has investors racing for the exit and funds exceeding the maximum 5% redemption cap. As a result, investors expecting to get all their money out have received pro-rated portions and will need to apply again in subsequent quarters.
At The Mather Group, we are very conscious of liquidity considerations when allocating to private assets in either the traditional closed-end structure or the newer generation of semi-liquid products. First, we carefully consider clients’ liquidity needs and only allocate a proportion of assets that will not be needed for a long time. Next, we carefully evaluate managers on our platform to select only ones with the expertise to manage through a business cycle so we can be confident in their ability to manage a downturn without feeling the need to liquidate holdings.
Cambridge Associates horizon index Data
as of September 25, 2025

Alternative Investments carry a higher degree of risk related to illiquidity, valuation, and lack of a public market where they can be bought and sold. Investing in Alternative Investments carries the risk of loss to some or all of your principal investment. Alternative Investments that fall under Rule 506 Regulation D of the Investment Company Act of 1940 (“the Act”) are considered unregistered funds, and therefore, are not regulated in the same way as a registered fund under the Act. Depending on the type of investment, a prospective investor must prequalify as an Accredited Investor or Qualified Purchaser under Rule 506 or Qualified Client defined under Rule 205-3 of the Investment Advisers Act of 1940 before investing. Please carefully review the investment’s Private Placement Memorandum (PPM) and/or other Offering Documents and Disclosures before investing in an Alternative Investment.
Looking Ahead
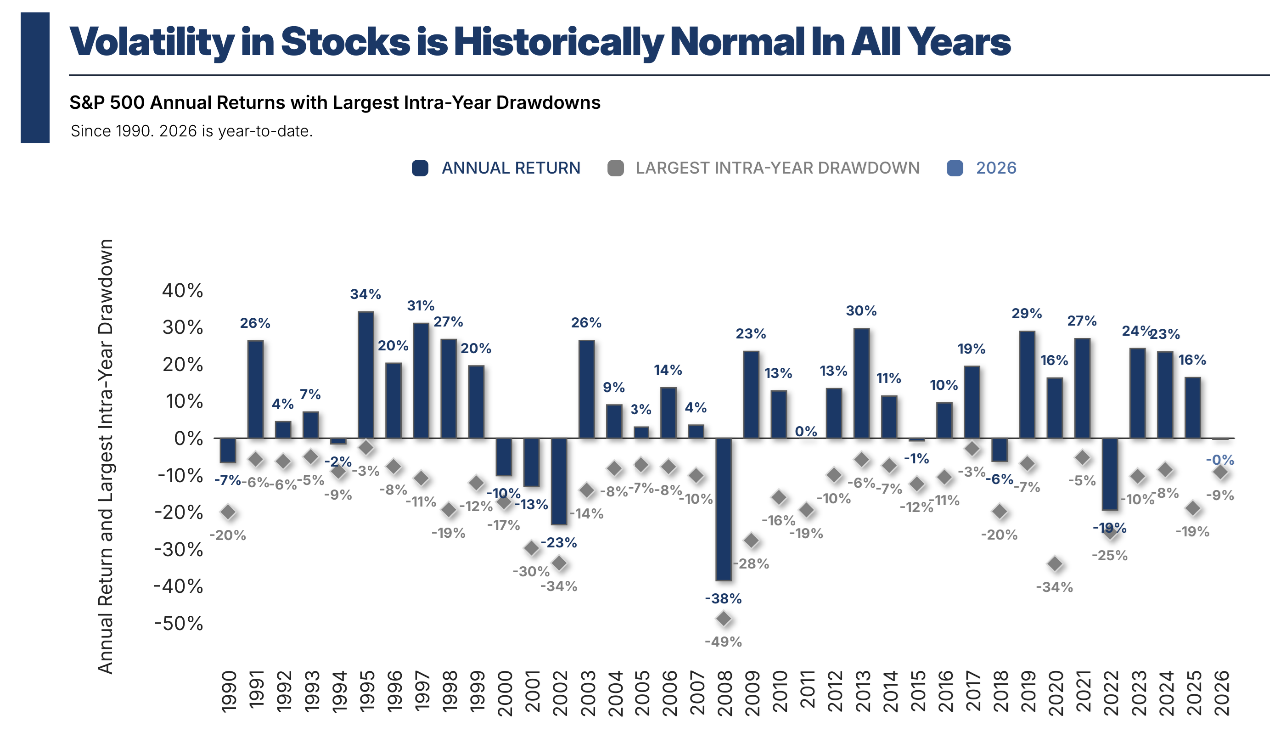
Although stock market volatility can be unsettling, it is a normal part of investing. Over the past 46 years, the S&P 500 has experienced an average intra-year decline of 14.2% yet still finished the year with positive returns in 35 of those years. The U.S. and Israeli strikes on Iran have created uncertainty around energy supply. However, since previous energy shocks, the U.S. economy is far less dependent on energy and is now one of the largest oil producers and a net exporter of oil. Markets frequently sell off as an initial reaction to geopolitical events but rebound quickly, recovering the loss within three months in most cases. Over longer periods, markets are influenced by long-term trends and underlying economic conditions with no difference in average returns six months following a geopolitical event.
The U.S. economy has remained resilient and may see additional support from fiscal stimulus. Many consumers received larger-than-expected tax refunds following last year’s tax cuts, providing a potential boost to near-term spending. Tariff refund checks later in the year could add further support. Economic fundamentals remain solid, with improving manufacturing activity and a still-low unemployment rate. This underlying strength should help offset some of the pressure created by higher energy prices.
In periods like this, where multiple factors are influencing markets at the same time, coordination across your financial plan becomes increasingly important. Decisions around investments, taxes, and income planning do not happen in isolation, and how they work together may have a meaningful impact on outcomes.
Sources
i SUPPLYCHAINDIVE “CBP’s tariff refund process will take up to 25 days to deliver returns”, March 31, 2026.
ii Tech Insider “Tech Layoffs 2026: How AI is Driving the Biggest Workforce Shakeup in a Decade”, March 19, 2026.
iii Barron’s “Weak Job Growth Poses Challenges for Fed Policy, Official Says”, April 3, 2026
iv 2026 U.S. Economic Events & Analysis – Consumer Confidence, Econoday, 3/31/2026
v 2026 U.S. Economic Events & Analysis – Consumer Sentiment, Econoday, 4/10/2026
vi 2026 U.S. Economic Events & Analysis – PMI Manufacturing Final, Econoday, 4/1/2026
vii 2026 U.S. Economic Events & Analysis – ISM Manufacturing Index, Econoday, 4/1/2026
viii 2026 U.S. Economic Events & Analysis – PMI Composite Final, Econoday, 4/3/2026
ix 2026 U.S. Economic Events & Analysis – ISM Services Index, Econoday, 4/3/2026
x 2026 U.S. Economic Events & Analysis – Employment Situation, Econoday, 4/3/2026
Need more help?
Contact The Mather Group, your advisor, health insurance professional, or your state’s health insurance assistance program (SHIP) for additional information. SHIP is a national program that offers one-on-one Medicare counseling and assistance to individuals and their families.


Key Highlights to Keep You Informed
Geopolitical Tensions and Energy Market Disruption
Geopolitical events were a prominent theme this quarter. In early January, the U.S. conducted military operations in Venezuela, followed by air strikes on Iran in late February. This escalation contributed to a sharp rise in energy prices, as tensions in the region disrupted shipping through the Strait of Hormuz, constraining oil flows from the Middle East and pushing prices above $100 per barrel.
Technology Sector Pressure from Artificial Intelligence
Concerns around artificial intelligence disruption weighed heavily on the technology sector during the quarter. Fears that automation could quickly erode traditional software business models and pricing power led to a broad selloff, particularly across software companies. Software stocks declined nearly 24% for the quarter, with weakness spreading across the broader technology sector, as measured by the S&P Software & Services Index.
Trade Policy Volatility and Legal Shifts
Trade policy developments added another layer of uncertainty during the quarter. The Supreme Court struck down tariffs announced last year, ruling that the International Economic Emergency Powers Act does not grant the president authority to impose taxes without congressional approval. Within hours of the decision, new 10% global tariffs were introduced under the Trade Act of 1974. Importers have begun registering for refunds of the overturned tariffs, accounting for roughly $120 billion of the total i.
Renewed Stagflation Concerns
Slowing GDP growth and rising inflation renewed concerns about stagflation, a term used to describe periods of weak economic growth paired with persistent inflation. Normally, slower growth is accompanied by easing inflation, which gives the Federal Reserve more flexibility to lower interest rates in support of the economy. With inflation still above target, that flexibility remains limited. Prior to the war with Iran, inflation remained above the Fed’s 2% target, though most readings pointed to a gradual deceleration. In March, the Consumer Price Index rose to 3.3%, driven largely by higher energy prices. Core inflation, which excludes food and energy, increased 2.6% and came in below expectations.
Labor Market Moderation and Structural Shifts
The labor market showed signs of softening after a strong start to the quarter. Following a solid January report, payrolls declined by 92,000 in February before rebounding with a stronger-than-expected gain of 178,000 jobs in March. The technology sector was notably impacted, with 45,363 layoffs announced during the quarter, with 20.4% explicitly tied to AI and automation ii. Some of the largest layoffs have come from Oracle, Amazon and Meta (Facebook). Weaknesses in job creation may not be an indicator of weakening economic conditions as growth in the labor force has also stalled, leading the Fed to look elsewhere for labor market readings iii.
Quarterly Market Summary
Returns (USD), as of March 31, 2026
Past performance is not a guarantee of future results. Indices are not available for direct investment. Index performance does not reflect the expenses associated with the management of an actual portfolio.
Market segment (index representation) as follows: US Stock Market (Russell 3000 Index), International Developed Stocks (MSCI World ex USA Index [net dividends]), Emerging Markets (MSCI Emerging Markets Index [net dividends]), Global Real Estate (S&P Global REIT Index [net dividends]), US Bond Market (Bloomberg US Aggregate Bond Index), and Global Bond Market ex US (Bloomberg Global Aggregate ex-USD Bond Index [hedged to USD]). S&P data © 2026 S&P Dow Jones Indices LLC, a division of S&P Global. All rights reserved. Frank Russell Company is the source and owner of the trademarks, service marks, and copyrights related to the Russell Indexes. MSCI data © MSCI 2026, all rights reserved. Bloomberg data provided by Bloomberg.
Notable Events in Q1:
January
An unexpected geopolitical development marked the start of 2026, as U.S. forces captured Venezuelan President Nicolás Maduro in a targeted operation. The event briefly lifted oil prices, though markets stabilized quickly as the disruption was viewed as limited. Venezuela holds the world’s largest crude reserves but represented just 0.8% of global supply in 2024, and any meaningful production increase will take time and investment. Trade policy remained fluid, with tariffs both introduced and withdrawn, including the removal of tariffs on eight European countries following NATO discussions around Greenland security. Inflation trends were largely in line with expectations, with November’s core Personal Consumption Expenditures rising 2.8% year over year, driven by recreational goods, vehicles, and healthcare services. Monetary policy also drew attention. The president nominated Kevin Warsh, known for a more hawkish stance on interest rates, to succeed Federal Reserve Chair Jerome Powell. Uncertainty remains around whether Powell will step down before his term concludes in 2028.
February
The month started on a positive note with encouraging economic data releases. The January jobs report released during the first week of February showed the economy created 130,000 new jobs, well ahead of expectations. Manufacturing activity was also stronger than expected, showing expansion for the first time in 10 months. Inflation also looked under control with a steady month-over-month increase of 0.3% in the Consumer Price Index (CPI). Despite mostly positive data, stocks were weak with the S&P 500 falling 60 points for the month.
March
As geopolitical tensions and market volatility ramped up following U.S-Israel strikes on Iran, the VIX climbed over 30% in early March, and oil prices rose by over 50% during the same period. Given these increases, energy and utility stocks performed well while technology stocks struggled. With inflation fears rising, the expectation of higher prices has led the Federal Reserve to pause rate cuts despite risk to the economy.
Economic Indicators
The first quarter delivered a mixed, but resilient economic backdrop, as geopolitical conflict in both Venezuela and Iran dampened sentiment, but economic data remained better than feared. Measures of Consumer Confidence iv and Consumer Sentiment v remain poor due to the ongoing war and higher gas prices. Despite increases to oil prices, the U.S. remains better positioned to weather the storm compared to prior oil shocks, as the U.S. is now a net exporter of oil, but still not completely immune given the global nature of the oil market and refining capabilities. Household balance sheets remain relatively healthy as well, indicating that consumers should be able to withstand adversity for a time.
Reversing course from previous quarters, manufacturing reports vi, vii have shown signs of improvement, as the sector has begun to grow despite ongoing geopolitical risks and tariff-related headwinds.
Conversely, service industries viii, ix have weakened as tariffs and pricing pressures have taken a toll, along with weakening employment. Employment data x has been better than feared, but the low unemployment rate is partially due to more people falling out of the labor force, and previous reports have been revised lower, increasing concern about the true strength of the labor market. Despite elevated concerns at a macro and headline level, we remain encouraged that the fundamentals that drive market returns remain promising. To illustrate, while valuations have gotten more expensive over time and should be acknowledged, realized earnings and earnings expectations have remained healthy. In fact, for the calendar year 2026, U.S. earnings are still expected to grow 17%, following the 14% growth seen in 2025. Even more encouraging, we expect to see growth from companies outside the Magnificent 7 and beyond AI-centric businesses, along with improved earnings overseas.
Market Impact on Major Asset Classes
Impact on Equities:
The first quarter saw a weak start in 2026, but not nearly as negative as market headlines indicated, with the S&P 500 and large-cap stocks only down 4.3% due to growth stocks struggling. These struggles highlighted a broader market rotation as value stocks performed better and small-cap stocks advanced. These market struggles, however uncomfortable, must be viewed within the context they deserve. Volatility is ever present, market corrections are frequent, and we are still well in positive territory over the past 12 months given the strong performance markets delivered in 2025.
Outside of the U.S., international stocks performed relatively well compared to U.S. markets and were down slightly. Developed international markets, measured by MSCI EAFE, fell 1.1% as much of the world struggled with higher inflation and oil prices. The MSCI Japan Index performed well and rose 1.5%, as their economy continues to improve given debt to GDP is lower, with higher underlying growth, increased tax receipts and healthier inflation. These dynamics make it more attractive for foreign and domestic investors to deploy capital into their market, which we believe is still attractively priced.
MSCI Emerging Markets was essentially flat despite a strengthening dollar, and an 8.9% quarterly decline in China where there have been some deflationary pressures. Taiwan and South Korea were both bright spots as they benefited from AI-related semiconductor demand.
A key theme continues to be geopolitical volatility throughout the world. While often terrible from a human perspective, it is important to remember that these issues are not the main driver of risk in the market. After all, long-term data shows that markets have frequently dealt with war and geopolitical issues. While the initial shock of an event may lead to periodic downturns, we often see strong stock market returns shortly thereafter. We maintain that a bigger risk to portfolios is a lack of diversification, improper risk levels, and ignoring fundamental issues like expensive valuations that historically lead to lower future returns.
Looking ahead, there are reasons to exercise caution, but earnings expectations remain positive, and we expect diversified investors to benefit given relatively attractive valuations outside of mega-cap U.S. stocks and attractive valuations outside of the U.S. The outperformance seen for international stocks in 2025 clearly illustrated the benefit of diversification, which has continued this year, just as it had in previous decades following strong performance in the U.S. Further, if AI becomes as transformative as many expect, we believe history may repeat as we saw with cycles involving technologies like railroads and the internet. As new technology develops, there is often a lag between the financial impact of the technology on its producers and end clients. Over time, we expect the benefits of AI on stock prices will flow beyond the major technology companies and benefit other areas of the market.
Major World Equity Market Performance
for Q1 2026
Impact on Fixed Income:
The U.S. Aggregate Bond, Treasury and municipal indices were essentially flat for the quarter. Treasury bills posted gains as investors sought out some protection from equity volatility. Municipals started the year off strong (up 0.94% in January) thanks in part to the January effect, wherein municipal issuance at the beginning of the year is low in relation to the amount of bonds maturing leading to an imbalance in the cash available to reinvest and the amount of new bonds available in the market. The outlook for the remainder of the year is more municipal issuance, in line with the previous few record setting years.
Treasury yields whipsawed throughout the quarter on international news with the 30yr dipping from 4.91% in January to 4.64% by the end of February, only to rise back to 4.98% towards the end of March on inflation fears.
Corporate investment grade and high yield spreads remain below their historical averages. While credit markets continue to show stability, current valuations suggest investors are not being fully compensated for the level of risk being taken.
Treasury Curve vs. Municipal Curve
Elevated yields in Treasuries and municipals present attractive entry points for those looking to balance some of the uncertainty in equities. A bond ladder allows a buy and hold investor to lock in yields. It is important to consider the tax bracket when deciding between municipals and Treasuries. As the tax bracket increases municipals generally provide a better tax adjusted yield than Treasuries.
Major Fixed Income Index Returns
for Q1 2026
Impact on Alternatives:
When investing in private markets, fund structure should be an important consideration. This issue has been brought to light by the recent challenges in private credit. Historically private assets had been available only for institutional investors such as endowments or pension funds and extremely wealthy families. Allocations were made through closed-end funds where the investor committed to provide a predetermined amount of capital over a period of years. When the fund manager or General Partner (GP) identified an investment opportunity, they “called” the capital from the investors or Limited Partners (LP). After the investment ran its course and the GP “exited” or sold the investment, capital is returned to the LP. There is no opportunity for LPs to liquidate the investment before capital is returned and typical fund lives can range from 10 to 15 years. While this is an ideal structure to match the liquidity of the fund to the liquidity of the underlying investment for investors with infinite time horizons, it is not a great structure for individual investors that can have unexpected expenses and may not be able to lock up assets for as long.
The investment industry has tried to solve this liquidity mismatch problem for individuals by offering funds with quarterly liquidity. While this solved one problem, it created another. These funds, sometimes called “semi-liquid” still need to match the liquidity of the fund structure with the liquidity of the investments held in the fund. To achieve this, these semi-liquid funds have redemption limits that are typically set at 5% of fund assets per quarter. This feature allows individuals down to $1 million in investable assets to access investments that were only available to large institutions. However, they should not be considered fully liquid investments and liquidity constraints need to be considered when making allocations to private assets even through semi-liquid funds.
Concerns have been raised in the direct lending segment of private credit markets as the asset class has undergone some stress in recent months. Although losses have not been realized, the anticipation of losses due to a downturn has investors racing for the exit and funds exceeding the maximum 5% redemption cap. As a result, investors expecting to get all their money out have received pro-rated portions and will need to apply again in subsequent quarters.
At The Mather Group, we are very conscious of liquidity considerations when allocating to private assets in either the traditional closed-end structure or the newer generation of semi-liquid products. First, we carefully consider clients’ liquidity needs and only allocate a proportion of assets that will not be needed for a long time. Next, we carefully evaluate managers on our platform to select only ones with the expertise to manage through a business cycle so we can be confident in their ability to manage a downturn without feeling the need to liquidate holdings.
Cambridge Associates horizon index Data
as of September 25, 2025
Alternative Investments carry a higher degree of risk related to illiquidity, valuation, and lack of a public market where they can be bought and sold. Investing in Alternative Investments carries the risk of loss to some or all of your principal investment. Alternative Investments that fall under Rule 506 Regulation D of the Investment Company Act of 1940 (“the Act”) are considered unregistered funds, and therefore, are not regulated in the same way as a registered fund under the Act. Depending on the type of investment, a prospective investor must prequalify as an Accredited Investor or Qualified Purchaser under Rule 506 or Qualified Client defined under Rule 205-3 of the Investment Advisers Act of 1940 before investing. Please carefully review the investment’s Private Placement Memorandum (PPM) and/or other Offering Documents and Disclosures before investing in an Alternative Investment.
Looking Ahead
Although stock market volatility can be unsettling, it is a normal part of investing. Over the past 46 years, the S&P 500 has experienced an average intra-year decline of 14.2% yet still finished the year with positive returns in 35 of those years. The U.S. and Israeli strikes on Iran have created uncertainty around energy supply. However, since previous energy shocks, the U.S. economy is far less dependent on energy and is now one of the largest oil producers and a net exporter of oil. Markets frequently sell off as an initial reaction to geopolitical events but rebound quickly, recovering the loss within three months in most cases. Over longer periods, markets are influenced by long-term trends and underlying economic conditions with no difference in average returns six months following a geopolitical event.
The U.S. economy has remained resilient and may see additional support from fiscal stimulus. Many consumers received larger-than-expected tax refunds following last year’s tax cuts, providing a potential boost to near-term spending. Tariff refund checks later in the year could add further support. Economic fundamentals remain solid, with improving manufacturing activity and a still-low unemployment rate. This underlying strength should help offset some of the pressure created by higher energy prices.
In periods like this, where multiple factors are influencing markets at the same time, coordination across your financial plan becomes increasingly important. Decisions around investments, taxes, and income planning do not happen in isolation, and how they work together may have a meaningful impact on outcomes.
Sources
i SUPPLYCHAINDIVE “CBP’s tariff refund process will take up to 25 days to deliver returns”, March 31, 2026.
ii Tech Insider “Tech Layoffs 2026: How AI is Driving the Biggest Workforce Shakeup in a Decade”, March 19, 2026.
iii Barron’s “Weak Job Growth Poses Challenges for Fed Policy, Official Says”, April 3, 2026
iv 2026 U.S. Economic Events & Analysis – Consumer Confidence, Econoday, 3/31/2026
v 2026 U.S. Economic Events & Analysis – Consumer Sentiment, Econoday, 4/10/2026
vi 2026 U.S. Economic Events & Analysis – PMI Manufacturing Final, Econoday, 4/1/2026
vii 2026 U.S. Economic Events & Analysis – ISM Manufacturing Index, Econoday, 4/1/2026
viii 2026 U.S. Economic Events & Analysis – PMI Composite Final, Econoday, 4/3/2026
ix 2026 U.S. Economic Events & Analysis – ISM Services Index, Econoday, 4/3/2026
x 2026 U.S. Economic Events & Analysis – Employment Situation, Econoday, 4/3/2026
Need more help?
Contact The Mather Group, your advisor, health insurance professional, or your state’s health insurance assistance program (SHIP) for additional information. SHIP is a national program that offers one-on-one Medicare counseling and assistance to individuals and their families.
.avif)